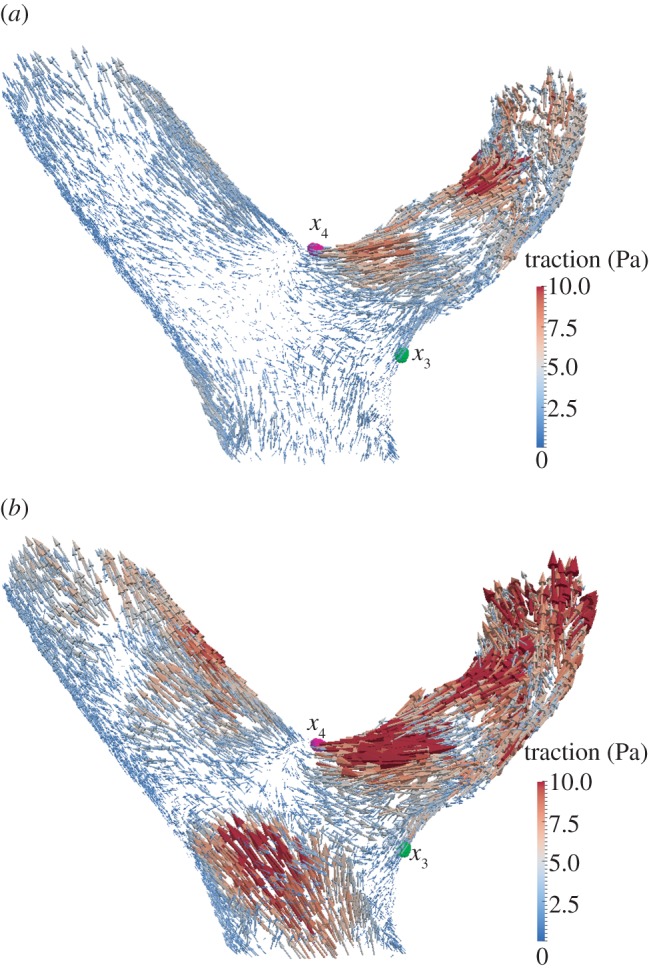
Figure 5.

Traction vector t (estimated with the CY rheology model) at the upstream bifurcation of the three-dimensional model. Vectors are scaled according to their magnitude. Points x3 and x4 in table 2 are shown in green and magenta, respectively. Visualizations generated with the open source software package ParaView [29]. (a) End of diastole t = 1.82 s; (b) peak flow during systole t = 1.97 s.
