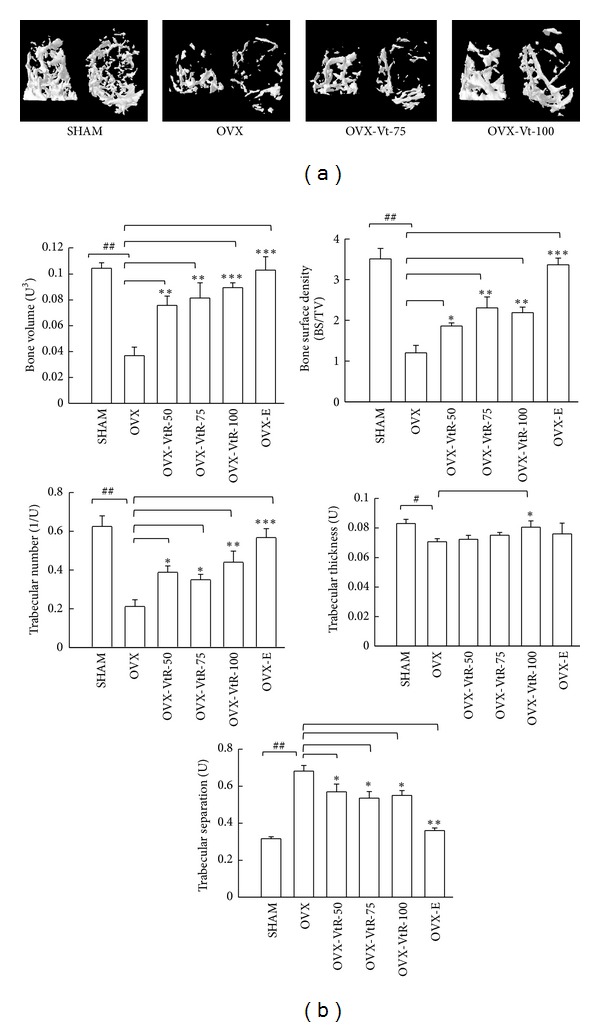
Figure 4.

Representative μ-CT images and selective μ-CT parameters of the distal femurs. (a) 3D tomographic rendering of distal femoral metaphysis trabecular bone reveals the complexity of the bone structure. The image on the left shows the side view, and the image on the right shows the top view. The abbreviations appearing here are the same as below. (b) Changes in femora microstructural parameters measured by μ-CT in sham-operated mice (SHAM), ovariectomized mice administered with vehicle (OVX), different dosages (50, 75, and 100 mg/kg) of VtR (OVX-VtR-50, -VtR-75, and -VtR-100), or 17β-estradiol (OVX-E) for 8 weeks. Values are mean (n = 8–10) with their standard error of mean (S.E.M.) represented by vertical bars. # P < 0.05 and ## P < 0.01, significantly different from the SHAM group; *P < 0.05, **P < 0.01, and ***P < 0.001, significantly different from the OVX group.
