
Figure 2.
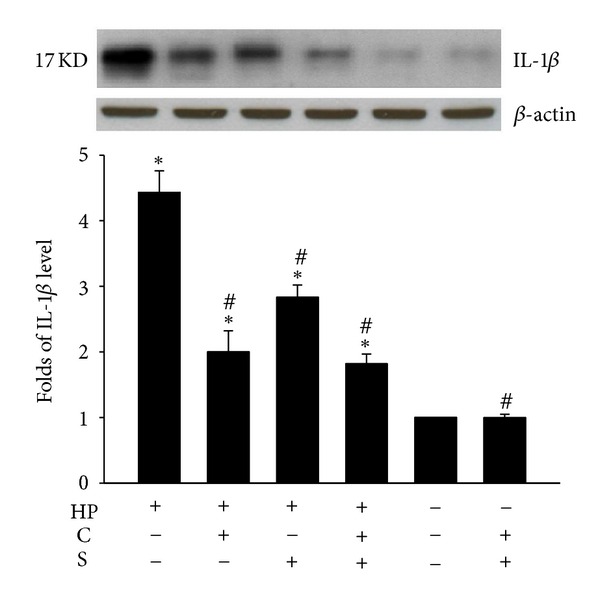
Effects of catechins (CAs) and/or sialic acid (SA) on IL-1β expression in AGS cells at 4 h after H. pylori (HP) infection. Upper panel, a representative western blot; lower panel, the fold change of the IL-1β levels relative to the expression in the untreated uninfected control, which was set at 1.0. Each column with a vertical line represents mean ± SEM (n = 3). *P < 0.05, compared to the untreated uninfected control; # P < 0.05, compared to H. pylori infection alone.