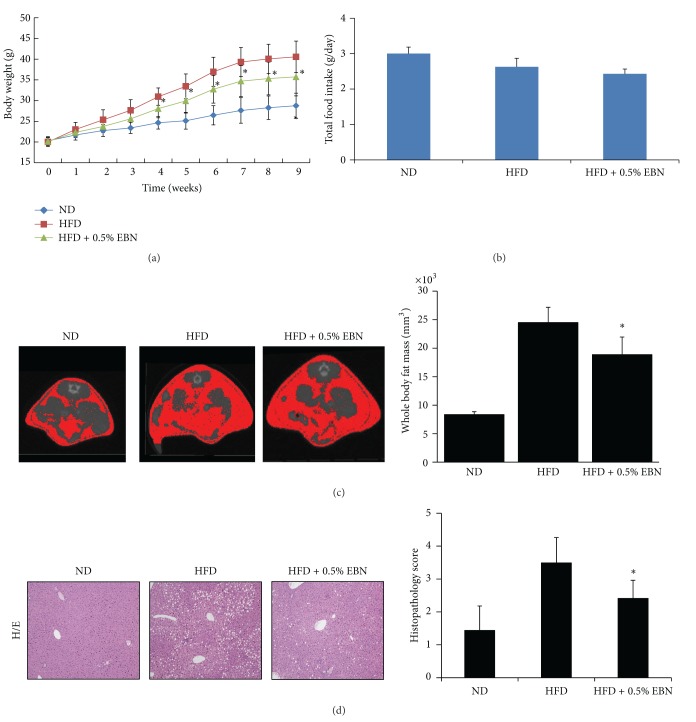
Figure 3.
The effect of EBN on body weight, total food intake, and accumulation of fat in the liver of mice fed a high-fat diet. Mice were fed normal diet (ND), high-fat diet (HFD), and high-fat diet with 0.5% EBN (HFD + 0.5% EBN). Body weight and food intake were measured every week ((a), (b)). Body fat mass was assessed using computed tomography (CT) during the 8 weeks (c). In addition, we measured the accumulation of fat in the liver as described in Section 2 (d). Data are expressed as the mean ± standard deviation (SD) (n = 10). Statistical significance: *P < 0.05 for the HFD versus HFD + 0.5% EBN.

