
Figure 7.
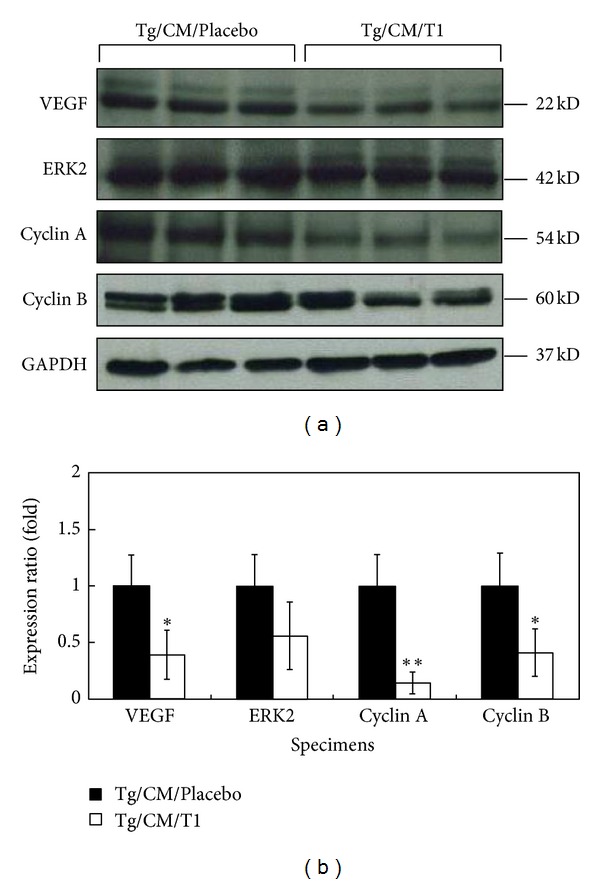
Protein expression levels of VEGF-A, ERK2, Cyclin A, and Cyclin B in the lung tissues of Tg/CM/Placebo and Tg/CM/T1 groups analyzed by western blots (a) and quantitative assay (b). GAPDH was used as an internal control. Protein expression was quantified as mean ± SEM (n = 6) from three independent repeat experiments. *P < 0.05 or **P < 0.01 versus Tg/CM/Placebo group.