
Figure 3.
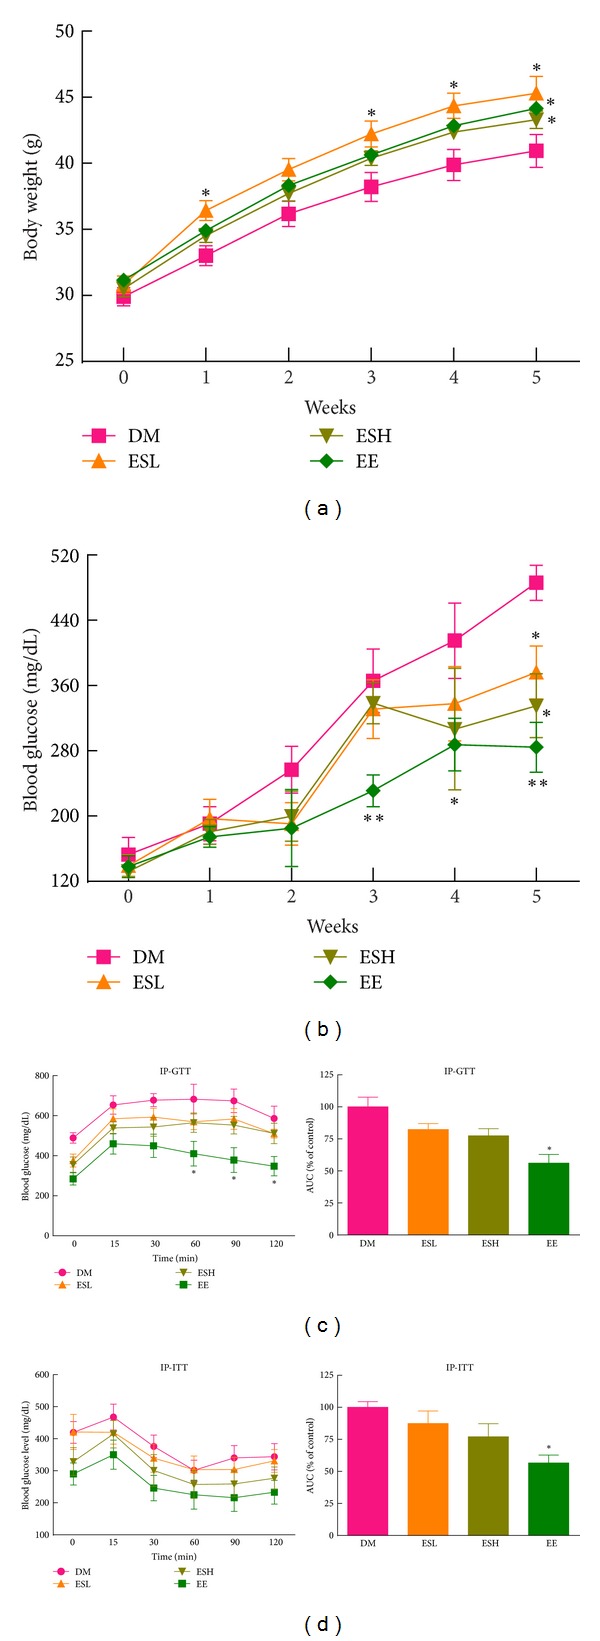
The effects of ESL, ESH, and EE on body weight, fasting blood glucose levels, and impaired glucose tolerance in db/db mice. (a) Body weight measurements during the experimental period. (b) Blood glucose levels after 4-hour fast. After feeding the experimental diet for 5 weeks, IPGTT (c) and IPITT (d) were performed. The area under curve (AUC) during IPGTT is also shown. Each value represents the mean ± SEM (n = 8). *P < 0.05 versus diabetes mellitus (DM) group. **P < 0.01 versus DM group.