
Figure 6.
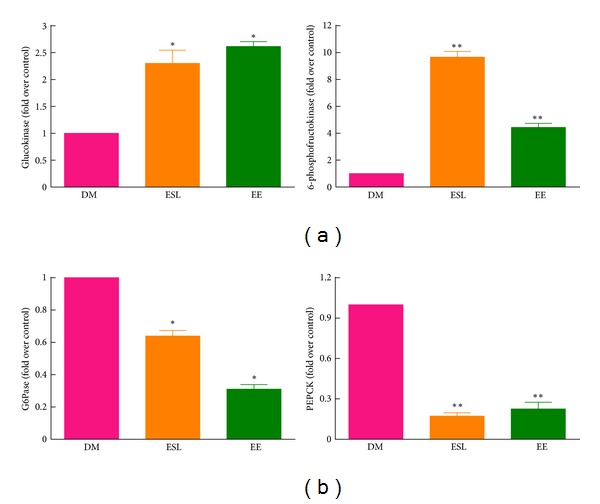
The effect of ESL and EE on hepatic glucose metabolism. (a) mRNA expression of the glycolysis-related genes, glucokinase and 6-phosphofructokinase, is shown. (b) mRNA expression of gluconeogenesis-related genes, G6Pase and PEPCK, is shown. After normalization of each gene to the 18S gene, mRNA levels are expressed as the percentage of diabetic mice. Values indicate the mean ± SEM. *P < 0.05 versus DM group. **P < 0.01 versus DM group.