Figure 2.

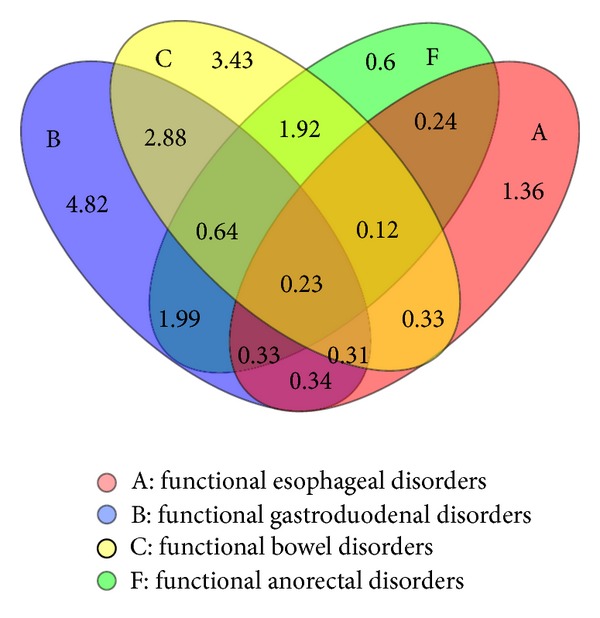
Venn diagram demonstrating overlap between functional esophageal, gastroduodenal, bowel and anorectal disorders in the study population based on Rome III criteria. The values correspond to prevalence (%) within a subset.

Venn diagram demonstrating overlap between functional esophageal, gastroduodenal, bowel and anorectal disorders in the study population based on Rome III criteria. The values correspond to prevalence (%) within a subset.