Figure 1.

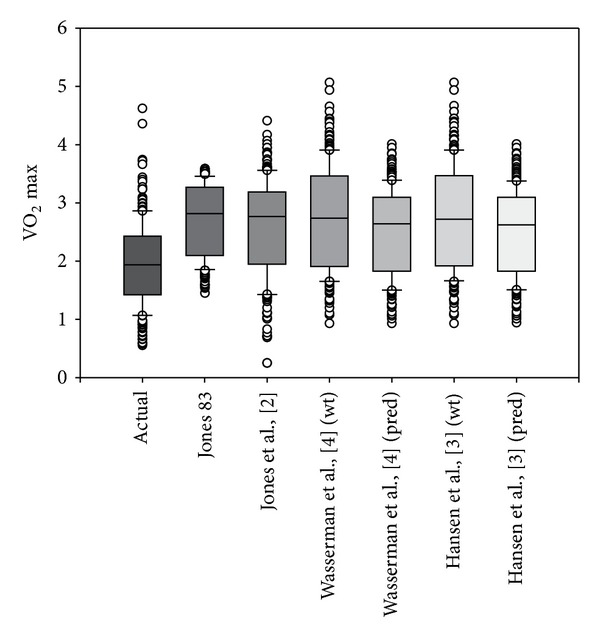
Figure indicates significant overestimation of predictors of VO2 max compared with actual measured VO2 max in this population. Significant differences among test (P ≤ 0.001).

Figure indicates significant overestimation of predictors of VO2 max compared with actual measured VO2 max in this population. Significant differences among test (P ≤ 0.001).