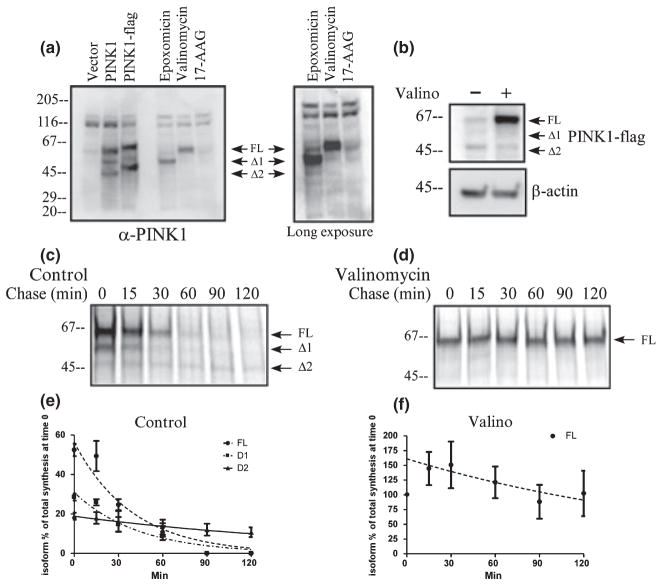
Fig. 1.
PINK1 processing is dependent on mitochondrial membrane potential. (a) Anti-PINK1 antibody was used to detect endogenous PINK1 as well as exogenous PINK1 in HeLa cells. Anti-PINK1 antibody detects over-expressed untagged or FLAG-tagged PINK1 and also detects the endogenous PINK1 when cells are treated with 1 μM epoxomicin or 1 μM valinomycin for 24 h. The accumulation of endogenous PINK FL and Δ1 confirms the expression pattern of the exogenous PINK1. The right panel shows an overexposure image to demonstrate the faint Δ2 band. (b) Stably transfected HeLa cells were treated with 1 μM valinomycin for 24 h and PINK1-flag steady state level was examined by western blotting with anti-Flag antibody. PINK1 FL accumulation is observed with valinomycin treatment, similar to the endogenous PINK1 FL in panel (a). (c and d) Metabolic labeling of HeLa cells transiently transfected with PINK1-flag. Proteins were labeled with 35S-met/cys trans-label for 3 min, chased with cold methionine and cysteine at various times noted in the figure, and analyzed by immunoprecipitation and exposure to phosphorscreen. Mitochondrial membrane potential was dissipated with 1 μM valinomycin during the starvation, pulse, and chase period. (e and f) Levels of each isoform of PINK1-flag were normalized as percentage of the total amount of labeled PINK1 (all three isoforms) present at the end of the labeling period and graphed over time. The data from three independent labeling experiments are graphed with mean ± SEM and curve fitted with a one-phase exponential decay. A representative figure from each experiment is shown in (c and d).

