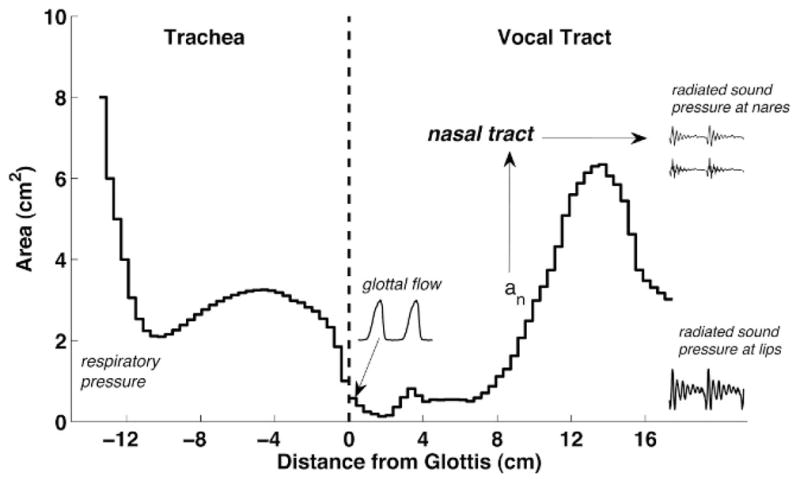
FIGURE 1.

Area function representation of the speech production model used to generate stimuli. The glottis is located at 0 cm, the trachea extends from the glottis in the negative direction, and the vocal tract extends in the positive direction. The vocal tract is configured in the figure as the /ɑ/ vowel. The nasal coupling location is indicated by the upward pointing arrow located at about 9.1 cm from the glottis. The nasal tract is indicated by the label. Waveforms are shown for glottal flow (sound source), radiated pressure at lips, and radiated pressure at the nares.
