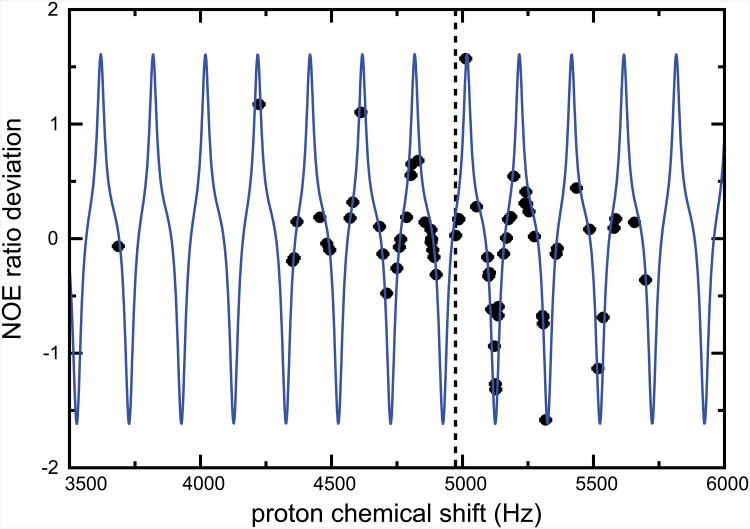
Figure 4.
Deviations of NOE ratios from the accurate value with a flip angle β = 10° and an interpulse delay τ = 5 ms. The differences between NOE ratios measured with β = 10° and β = 180° are shown as black dots. Numerical calculations (solid blue line) of the difference between the NOE ratios obtained with β = 10° and β = 180° for a 15N-1H pair with S2 = 0.7 and τe = 60 ps. In both experiments and simulations, the RF amplitude was ω1/(2π) = 9 kHz, the carrier was placed at 8.2 ppm, and the Larmor frequency of the protons was 600 MHz.

