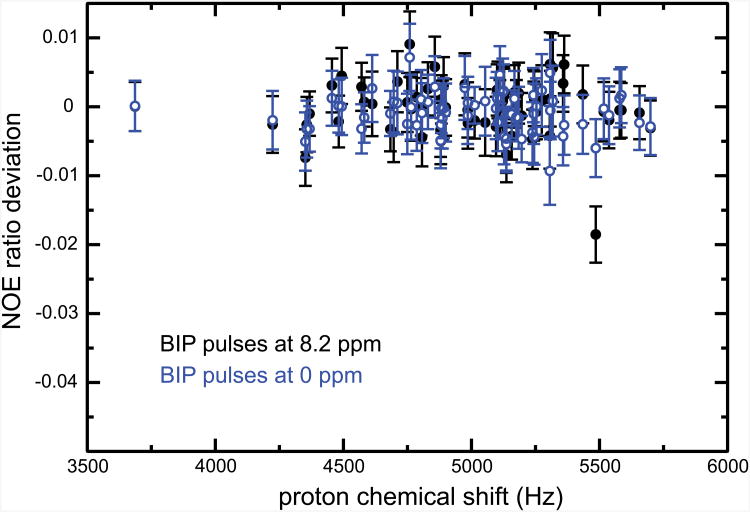
Figure 5.
Deviations of NOE ratios when a BIP pulse is used in the effective saturation scheme, as presented in Fig. 1d. Experimental details are given in Fig. 1, the proton Larmor frequency was 600 MHz. Solid black circles correspond to data obtained with BIP pulses applied at 8.2 ppm. Open blue circles are deviations obtained with the carrier positioned at 0 ppm during saturation. Each point corresponds to the amide 15N-1H pair for a specific residue in human ubiquitin. As in other figures, deviations were derived using as the “accurate” value of NOE ratios those obtained with the scheme of Fig. 1b, ω1/(2π) = 9 kHz; τ = 22 ms; β = 180°; and the duration of saturation 4 s.

