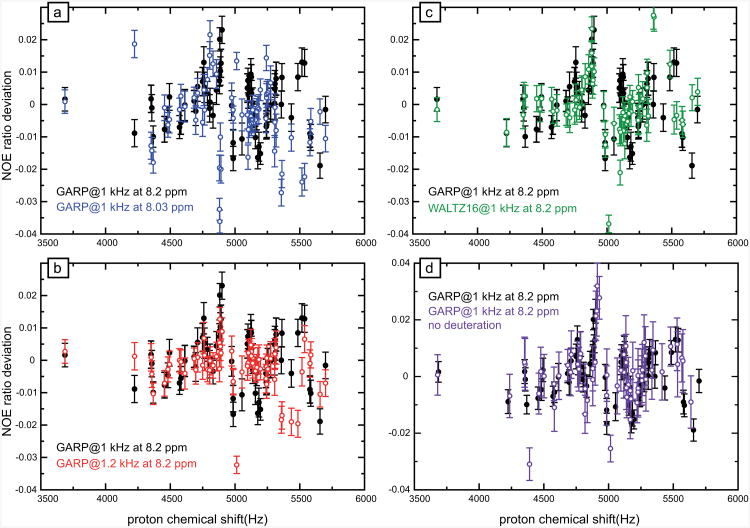
Figure 6.
Deviations of NOE ratios at 600 MHz with several CPD schemes for effective saturation of protons. (a-d) Deviations of NOE's measured with a GARP decoupling scheme applied with the carrier at 8.2 ppm and an RF amplitude ω1/(2π) = 1 kHz are shown as black solid circles for comparison. (a) NOE ratio deviations (blue open circles) when the carrier is placed at 8.03 ppm (-100 Hz shift) with an identical GARP effective saturation scheme. (b) NOE ratio deviations when WALTZ-16 CPD is used with the same carrier and RF amplitude (green open circles). (c) NOE ratio deviations when the RF amplitude is increased to 1.2 kHz with the same GARP CPD with identical carriers (red open circles). (d) NOE ratio deviations measured on a fully protonated sample of human ubiquitin (open magenta circles). The datasets on both samples were recorded with identical experimental parameters on the same spectrometer. The reference value for NOE ratio was recorded with the same experimental parameters as for Figs. 2-5. Each point corresponds to a 15N-1H pair for a rigid residue in human ubiquitin.

