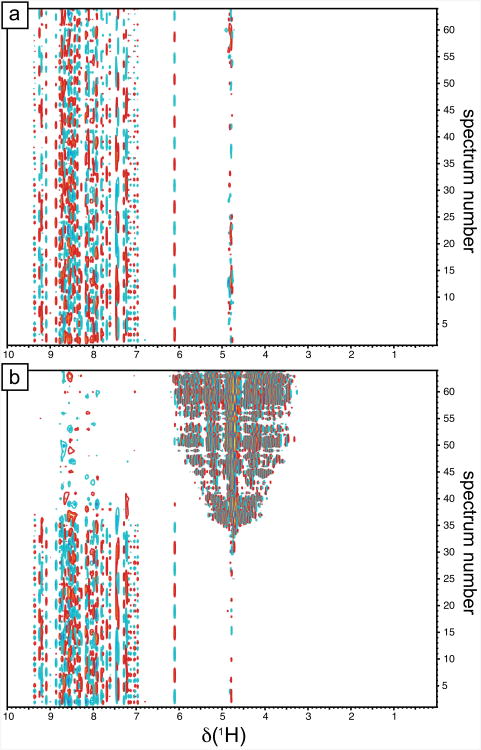
Figure 7.
Two-dimensional datasets for the reference experiment. Fourier transform was performed in the direct dimension only. Data were acquired on a spectrometer equipped with a cryoprobe with z-axis gradient and a proton Larmor frequency of 500 MHz. (a) Reference experiment recorded with the sequence presented in Fig. 1a. (b) Reference experiment recorded with the sequence presented in Fig. 1a modified so that the proton decoupling during the delay t1 is performed with a single 180° pulse at the midpoint of the delay t1, further phases are corrected to preserve the water flip-back scheme [31]. Only odd-numbered spectra are displayed (numbered 1-64 out of 1-128). The maximum value of t1 was t1max = 52.6 ms in both experiments.

