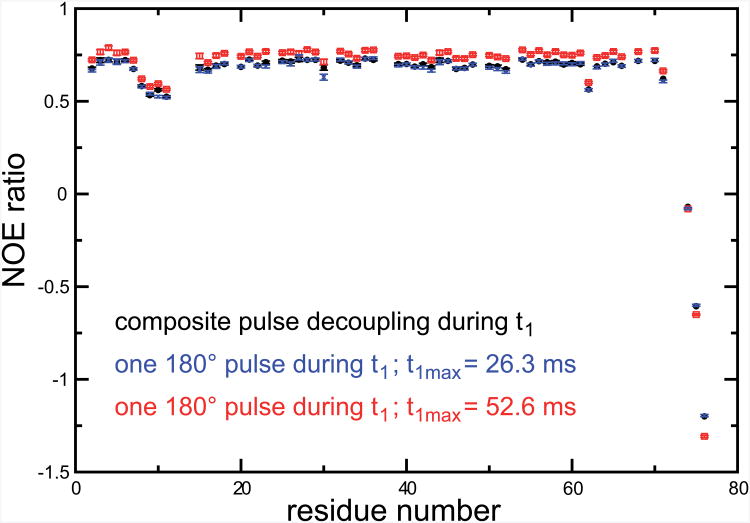
Figure 8.
NOE ratios measured at 500 MHz on a sample of perdeuterated human ubiquitin. In all experiments, the saturation scheme of Fig. 1b was employed. NOE ratios measured with the sequence presented in Figure 1a are shown as black circles, the maximum value of t1 was t1max = 52.6 ms. Open red squares represent NOE ratios measured under the same conditions with a modified sequence with no CPD during t1, as introduced in Fig. 7b. Blue crosses show the NOE ratios obtained from the same dataset but keeping only time points in the indirect dimensions with t1 ≤ 26.3 ms.

