Figure 1.
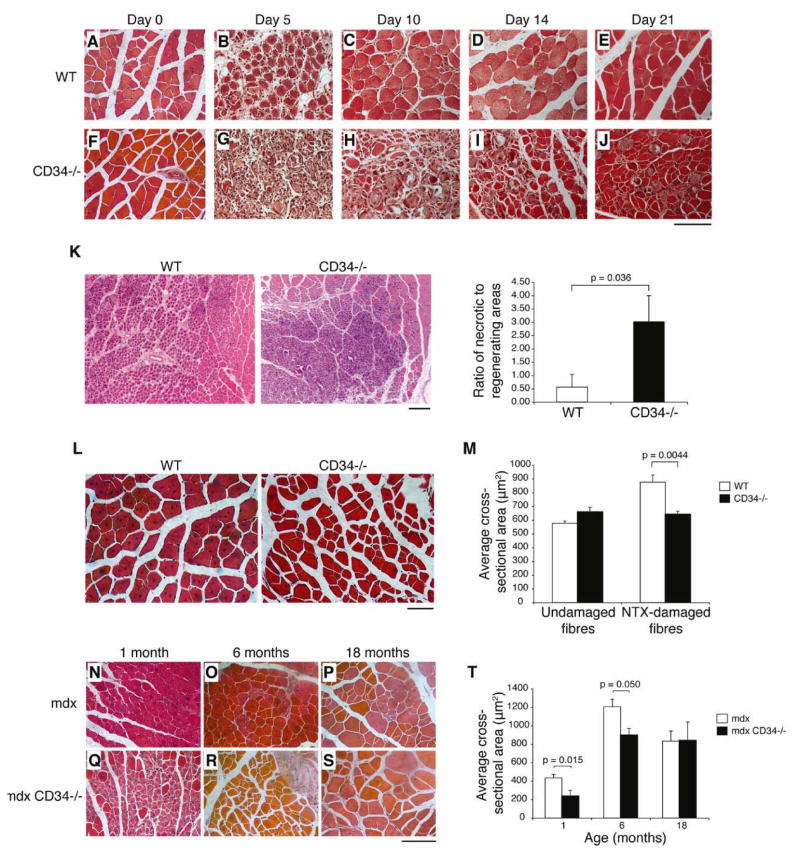
Impaired skeletal muscle regeneration in Cd34−/− mice. (A–J) H&E staining of WT and Cd34−/− muscles following acute NTX damage. TA muscles were analyzed at days 0 (A, F), 5 (B, G), 10 (C, H), 14 (D, I), and 21 (E, J) post-NTX damage (n=5–6 mice). Scale bar=100 μm. (K) Quantification of necrotic and regenerating areas of damage 5 days after NTX. Error bars represent ± SEM for n=4–6 mice. Scale bar=200 μm. (L) H&E staining of muscle sections showing centrally nucleated myofibers 21 days after NTX damage. Scale bar=50 μm. (M) Myofiber CSA measurements were performed on undamaged (day 0) and damaged (day 21) myofibers. Error bars represent ± SEM for n=5–6 animals with >200 fibers per animal. (N–S) H&E staining of mdx and mdx/Cd34−/− muscle sections at 1 (N, Q), 6 (O, R), and 18 (P, S) months of age. Scale bar=100 μm. (T) CSA measurements performed on regenerating myofibers of mdx and mdx/Cd34−/− muscles at 1, 6, and 18 months of age. Error bars represent ± SEM for n=3–5 mice with > 200 fibers per animal.

