Figure 5.
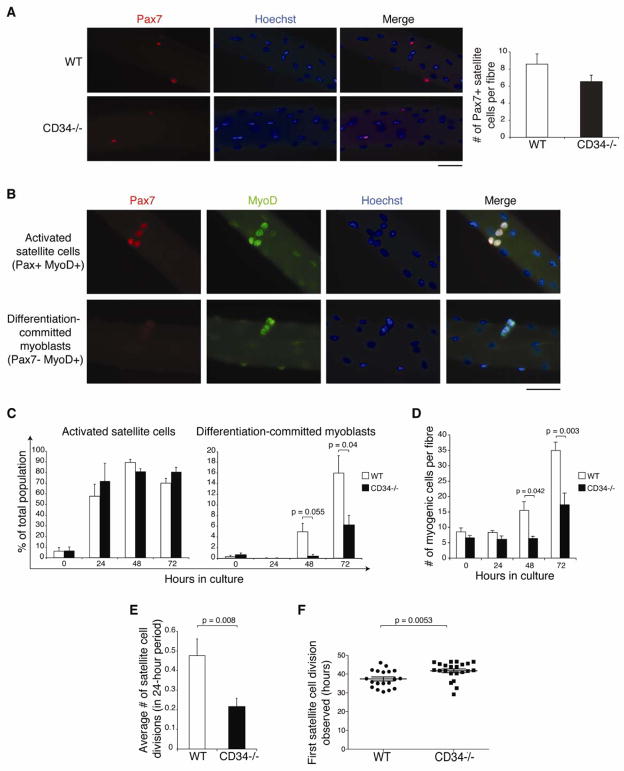
Defective activation of Cd34−/− satellite cells. (A) Immunofluorescent detection and enumeration of satellite cells on WT and Cd34−/− single fibers (Pax7, red; Hoechst, blue). Scale bar=50 μm. Error bars represent ± standard deviation for n=5–7 animals. (B) Combined Pax7 and MyoD staining on single fibers identify two subpopulations of myogenic progenitors: Pax7+ MyoD+ as activated satellite cells and Pax7− MyoD+ as differentiation-committed myoblasts (Pax7, red; MyoD, green; Hoechst, blue). Scale bar=50 μm. (C) Quantification of activated satellite cells and differentiation committed myoblasts on WT and Cd34−/− cultured fibers. Error bars represent ± standard deviation for n=3–7 animals per time-point. (D) Total myogenic cells counted per fiber. Error bars represent ± SEM for n=3–7 animals per time-point. (E) Number of satellite cell divisions detected using time-lapse microscopy between 24 and 48 hours after fiber culture initiation. Error bars represent ± SEM for n=42–107 satellite cells. (F) Timing of first division of individual satellite cell. Line represents the mean values ± SEM for n=19–22 satellite cells in 5–7 mice.

