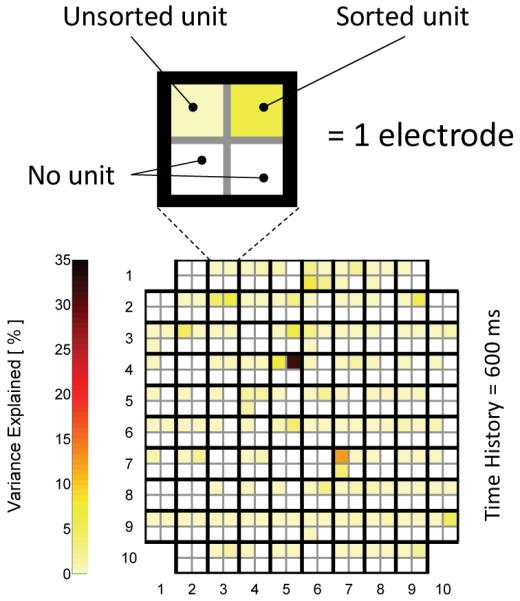
Figure 1.

Color plot of electrode array where a group of four squares is an electrode (top left unit is unsorted) and individual squares are potentially sorted units with variance explained of wrist flexion position shown by cell color. Results are from one trial 966 days post-implant.
