Figure 5.
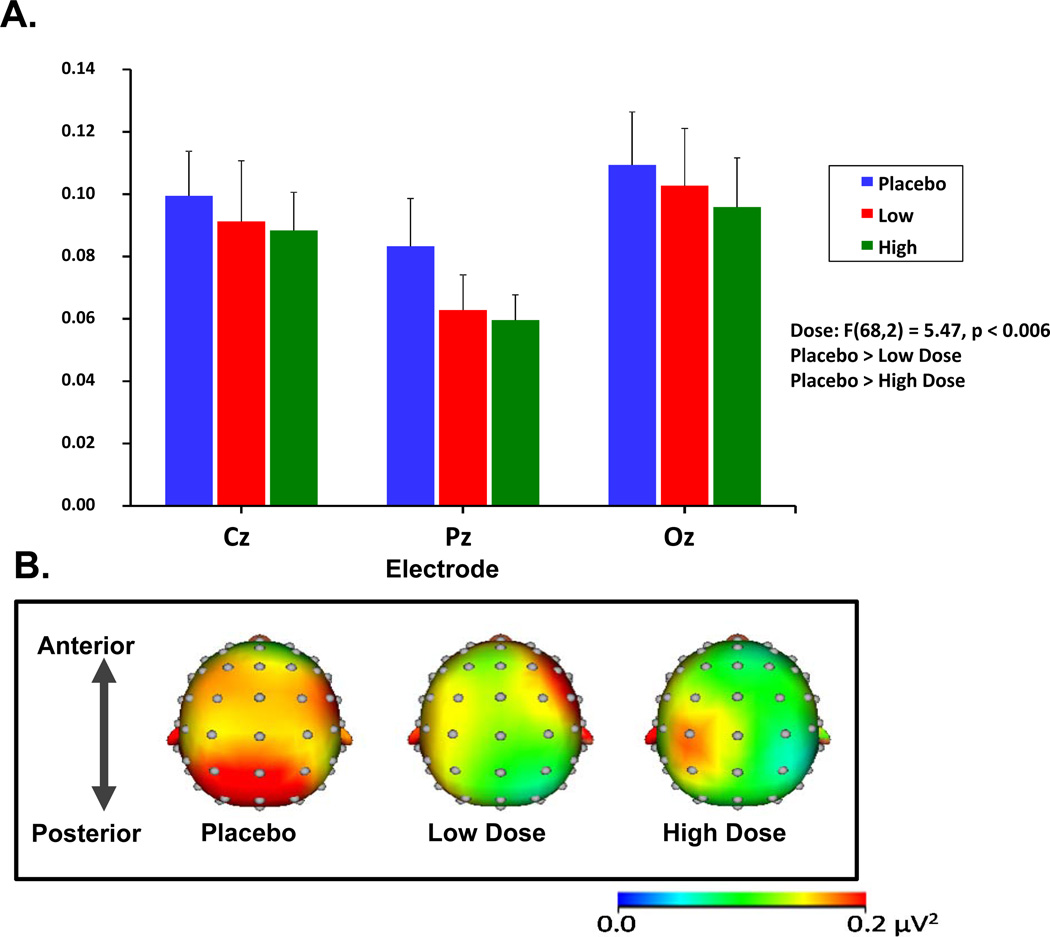
Salvinorin A (SA) administration induced reductions in resting beta-band EEG power.
Figure 5A depicts the grand-averaged resting EEG spectral power in the beta range (13–29 Hz) at midline electrode sites. Error bars represent S.E.M.
Figure 5B depicts the topographic maps indicating grand-averaged beta power across the placebo and the two active SA doses.

