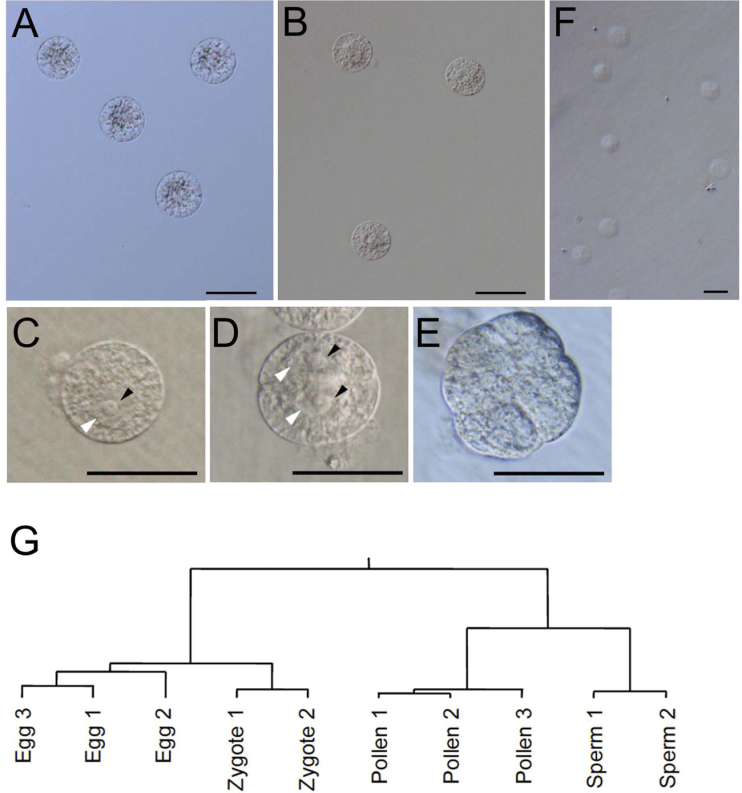
Fig. 1.
Isolated rice cells, cultured zygotes, and hierarchical clustering of expressed genes in the cell types. (A) Egg cells. (B) Zygotes. Zygotes were further cultured for 0 (C), 14 (D), and 37h (E). Black and white arrowheads indicate nucleoli and nuclei, respectively. (F) Sperm cells. (G) Hierarchical clustering tree of egg cells, zygotes, sperm cells, and pollen grains. Bars=50 μm in A–E; 10 μm in F.

