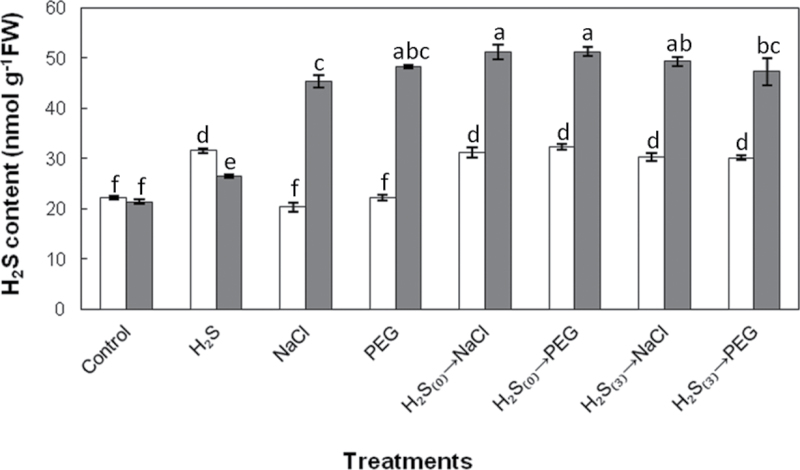
Fig. 2.
Effect of 100 μΜ NaHS root pretreatment on leaf H2S content at the initiation (day 0, white bars) and 7 d (grey bars) after stress imposition. Treatment acronyms are as described in the legend to Fig. 1. Data are means ± SE of three replications. Bars with different letters are significantly different (P < 0.05). FW, freshweight.

