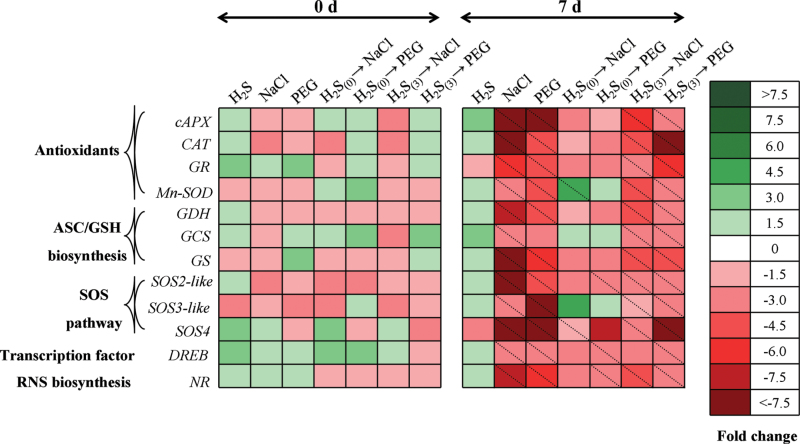
Fig. 7.
Heat map showing temporal expression pattern in selected genes associated with enzymatic antioxidants, RNS biosynthesis, redox homeostasis, and SOS pathway in leaves of strawberry plants under non-stress and NaCl/PEG stress conditions. Following root pretreatment with 100 μΜ NaHS 3 d before stress imposition or until application of the stress factor, plants were grown with or without 100mM NaCl or 10% (w/v) PEG-6000 for 7 d as described schematically in Supplementary Fig. S1. Tissues were sampled immediately after H2S pretreatment (day 0) and 7 d after pretreatment. Relative mRNA abundance was evaluated by quantitative real-time RT-PCR using three biological repeats. Upregulation is indicated in green; downregulation is indicated in red; diagonal dotted lines represent statistically significant differences compared with control samples (P < 0.05). A scale of colour intensity is presented as a legend. Actual relative expression data, obtained from three independent replicates, are shown in Supplementary Table S2.

