Fig. 2.
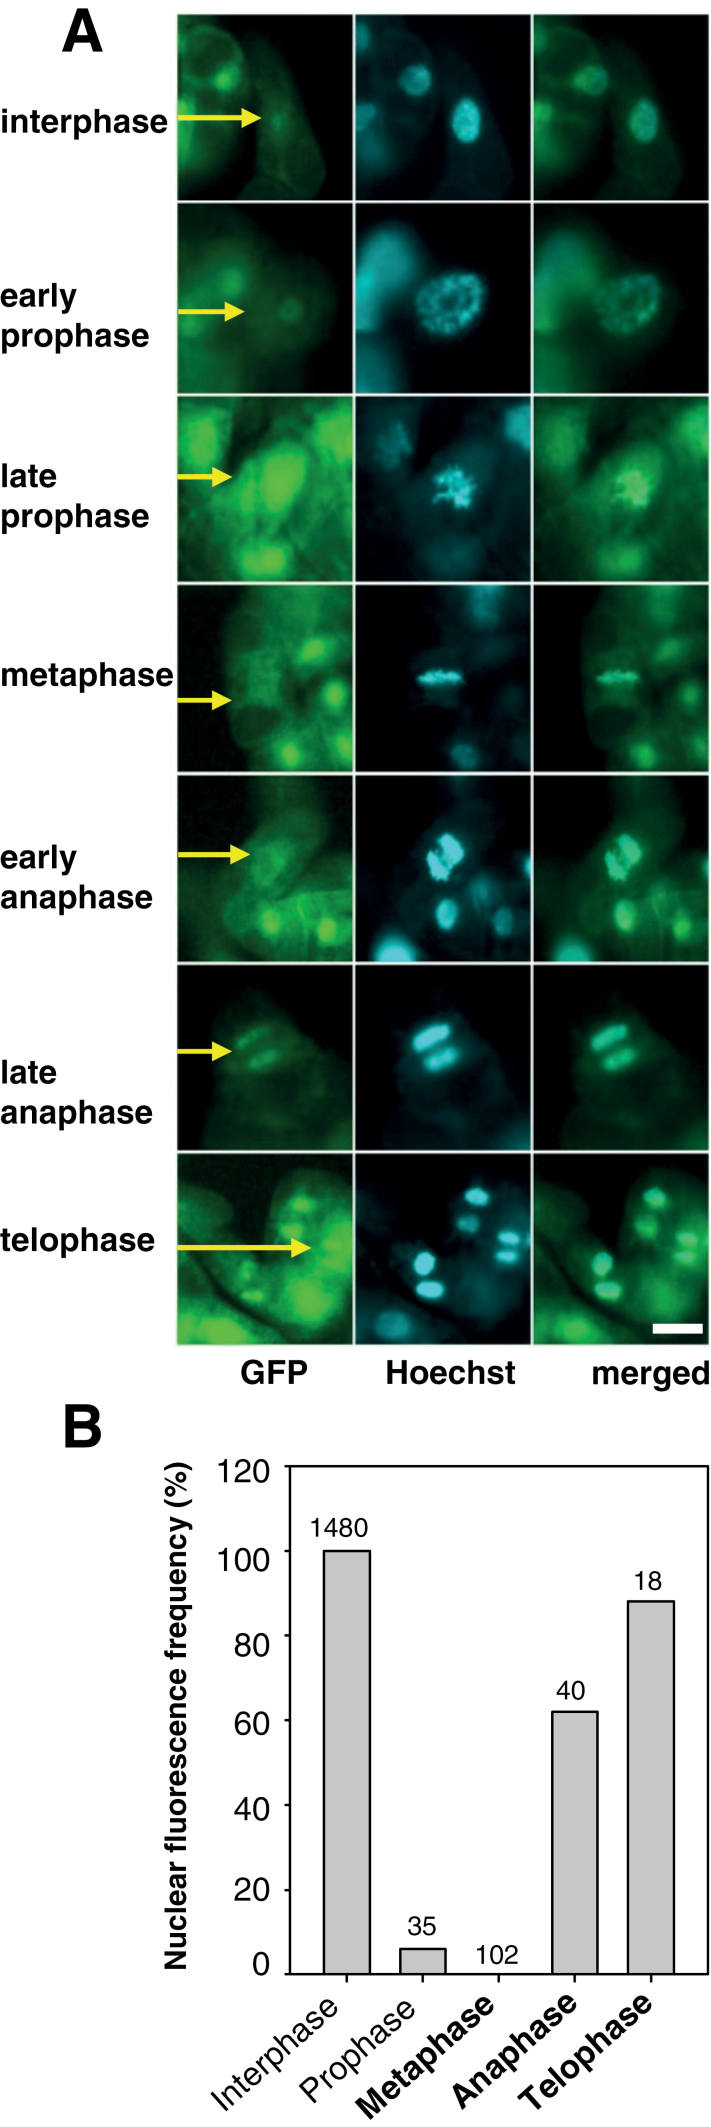
In the AtWEE1–GFP line, GFP signal is greatly reduced in metaphase and early anaphase. (A) 35S::AtWEE1–GFP (GFP, Hoechst, and merged GFP–Hoechst; Hoechst λ=420nm GFP λ=530nm). Yellow arrows indicate a representative cell; scale bar=50 µm for all images. (B) Nuclear fluorescence frequency (%) of cells sampled from the synchronized 35S::AtWEE1–GFP cell line. n values are indicated on each bar. Contingency χ2=1511 df 4, P < 0.001.

