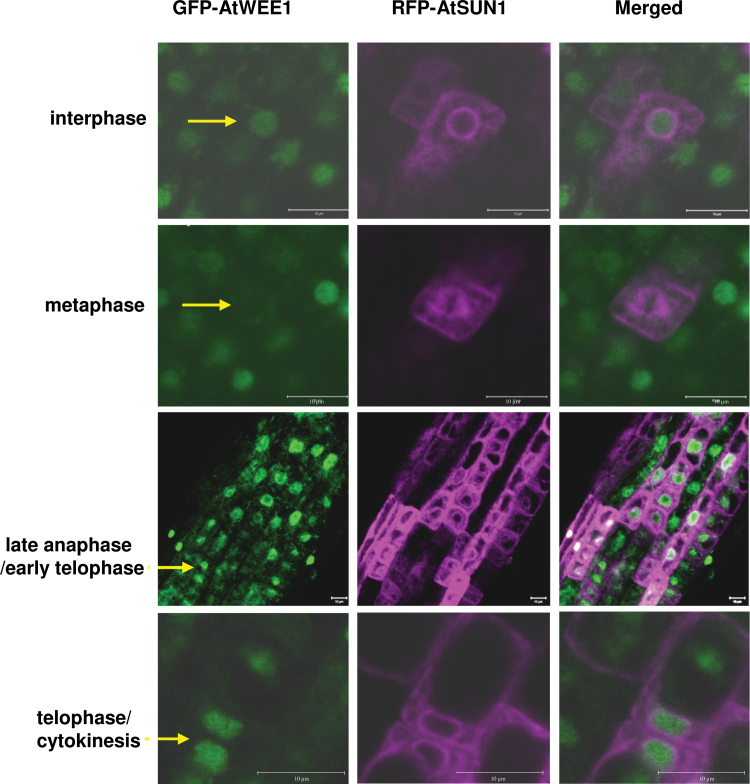
Fig. 3.
AtWEE1–GFP and AtSUN1–mRFP expression in different cell cycle phases in roots of transgenic Arabidopsis expressing both genes. Green colouring indicates AtWEE1–GFP expression, while purple colouring indicates AtSUN1–mRFP expression. Scale bar=10 µm. Yellow arrows indicate a representative cell.

