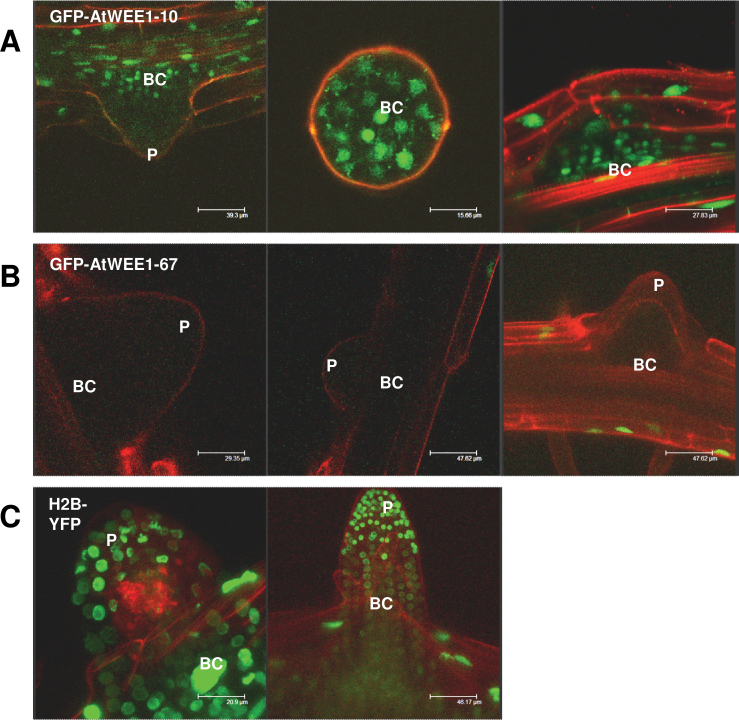
Fig. 4.
Lateral root primordia of AtWEE1–GFP lines #10 and #67, and H2B–YFP seedlings. (A and B) Green colouring indicates AtWEE1–GFP expression in two independent lines, #10 and #67. (C) Green indicates H2B expression. Red colouring is propidium iodide counterstain for the cell walls. Representative images of at least five seedlings examined. P, lateral root primordium; BC, basal cells of lateral root primordium. Note that the middle image of (A) is a primordium seen from above, and demarcated by propidium iodide counterstaining.

