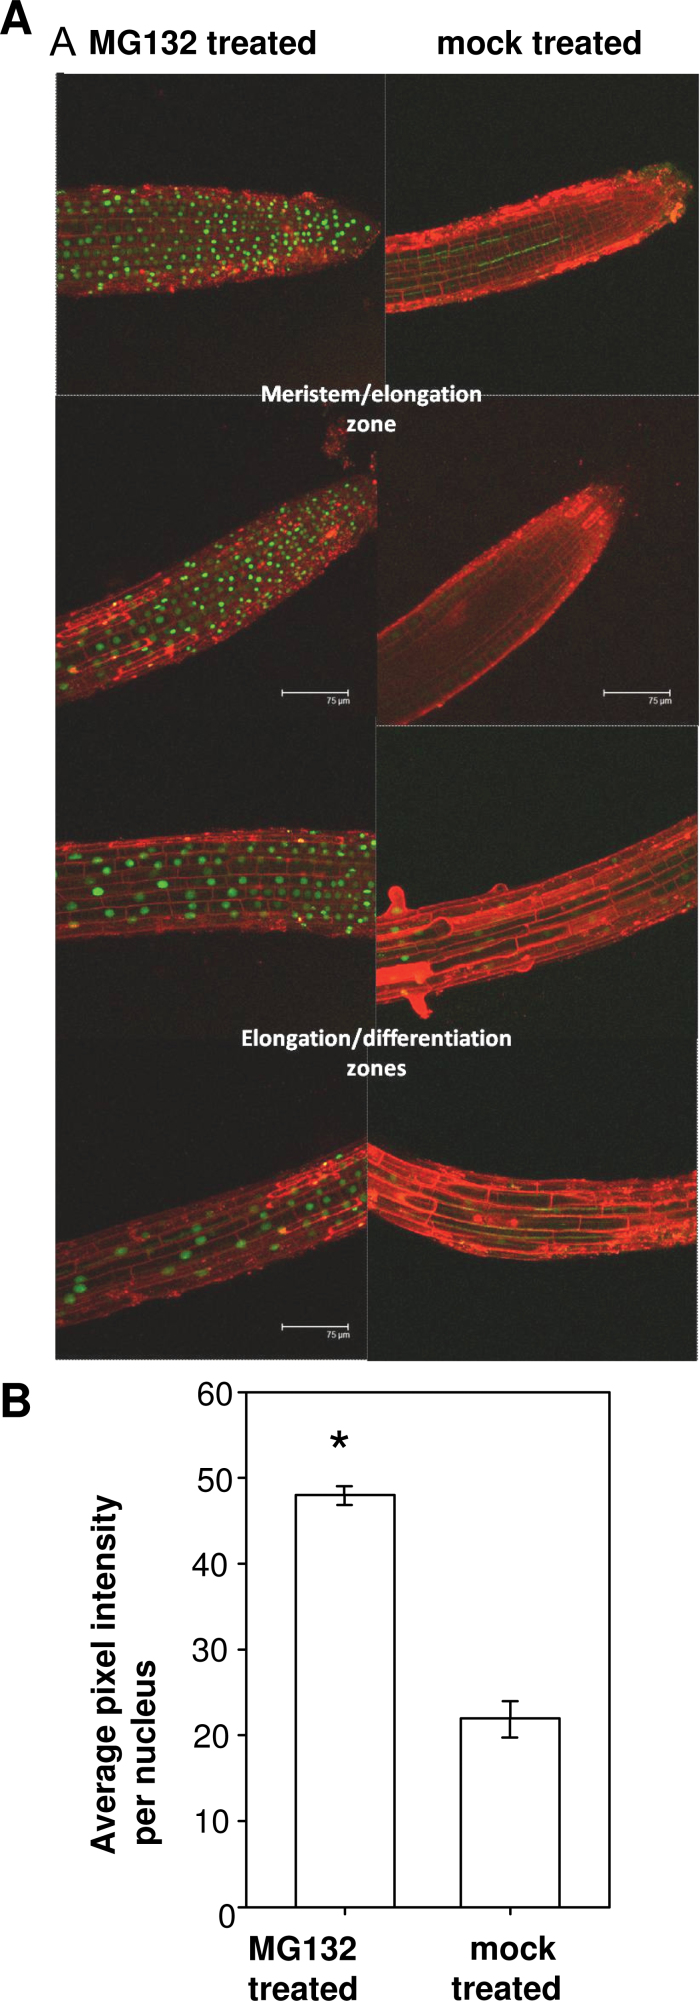
Fig. 5.
MG132- and mock-treated 5-day-old AtWEE1–GFP line # 67 seedlings. (A) Confocal images of root tips and more basal regions: green indicates AtWEE1–GFP expression and red is propidium iodide counterstain for the cell walls. Representative images of three seedlings examined for each treatment. To allow for accurate and direct comparison between the two treatments, the confocal settings were not altered between the imaging of the MG132-treated and mock-treated seedlings. (B) GFP signal intensity (±SE). *Significant difference between treatments (P < 0.05; n= ≤466 to ≥2121).

