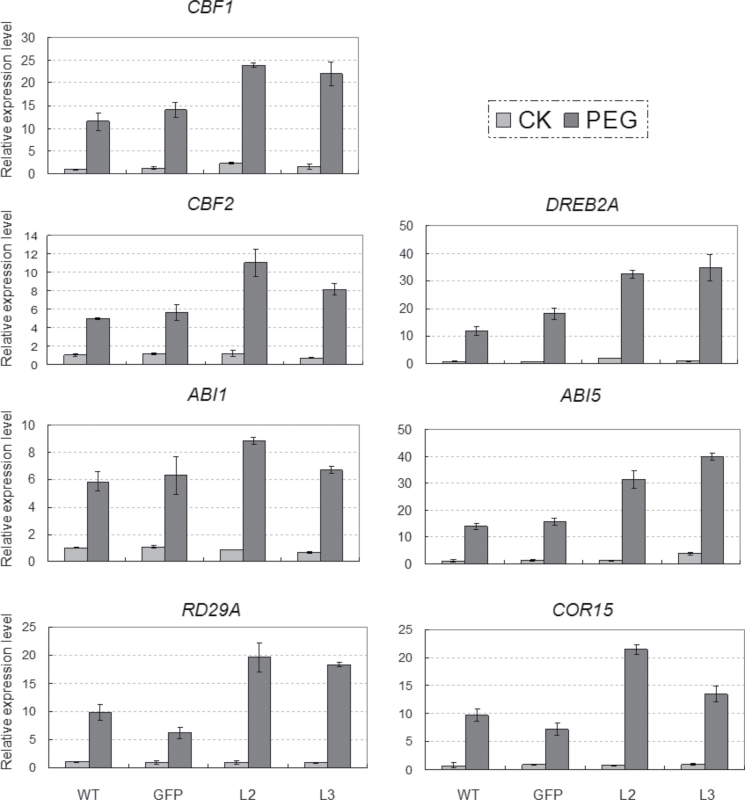
Fig. 10.
Comparisons of relative transcript levels of CBF1, CBF2, DERB2A, ABI1, ABI5, RD29A, and COR15 in the control plants and TaSnRK2.3 transgenics treated with PEG-6000 (–0.5MPa). Columns indicate relative transcript levels. Ten seedlings were pooled as a sample, and three samples were collected for each line and three duplications were performed for each sample in qRT-PCR. The values (±SE) were calculated from three independent experiments.

