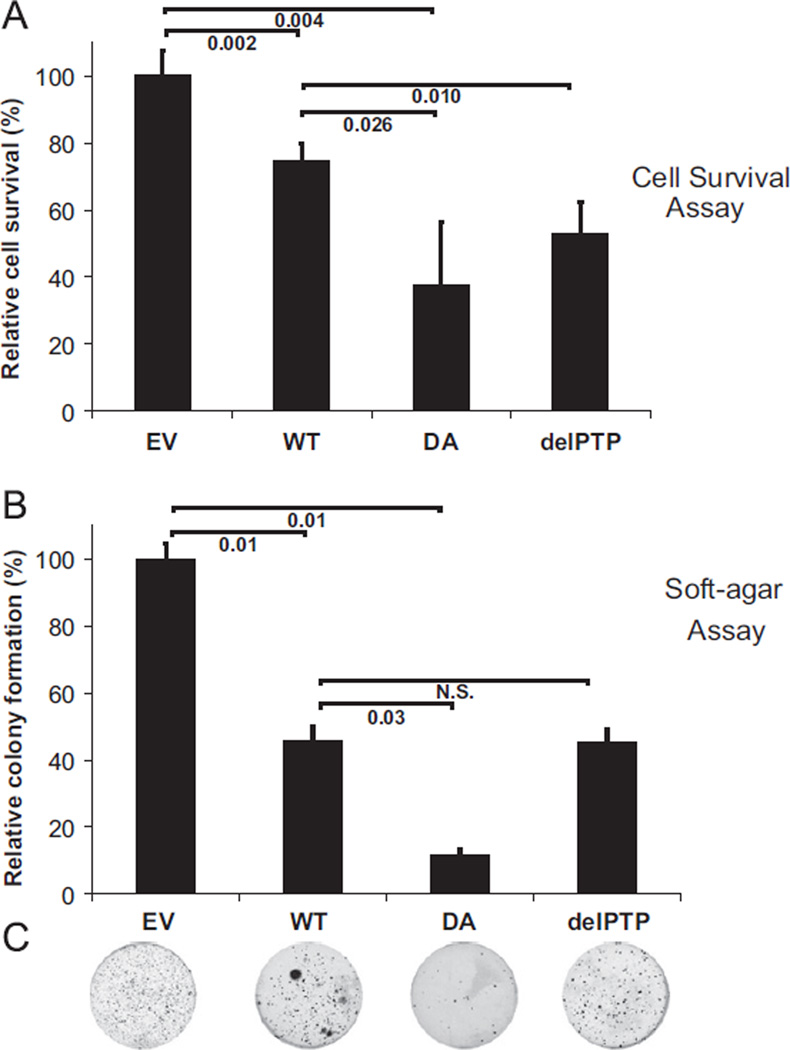
Fig. 3.
PTPL1-DA inhibits ES cell proliferation. (A) TC32 cells were transfected with wild-type (WT) or DA substrate-trapping mutant (DA) PTPL1 expression vectors, or with control empty vector (EV). Cells were plated on 96-well plates in triplicate. Twenty-four hours after transfection viable cells were quantified by MTT. Bar graph represents cell survival reported as mean ± s.d. relative to empty vector transfected control cells. Numbers under brackets represent p-values calculated using Student’s t-test. (B) TC32 cells were transiently transfected with PTPL1 expression vectors wild-type (WT), DA substrate-trapping mutant (DA), catalytic PTP-domain removed from PTPL1 (delPTP) or control empty vector (EV). Cells were seeded in duplicate in soft-agar after transfection. After 3 weeks visible colonies were stained with MTT. Bar graph represents the colony counts reported as mean ± s.d. relative to empty vector transfected control cells. Numbers under brackets represent p-values calculated using Student’s t-test. Representative images from plates carrying colonies of cells transfected with each construct is shown below the bar graph.

