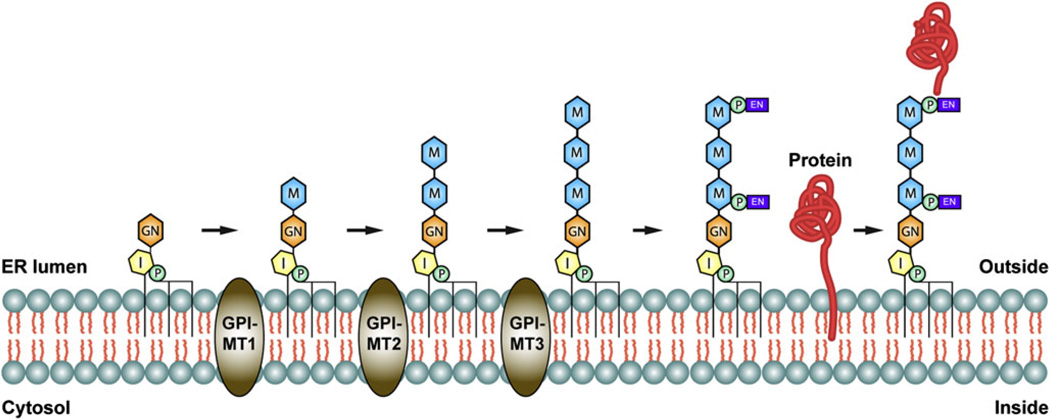
Fig. 1.
The GPI-MTs in GPI anchor biosynthesis. Graphic representation of key steps in the GPI biosynthesis pathway, showing how GPI-MT1, GPI-MT2, and GPI-MT3 function in the sequential addition of the core mannose residues to the growing GPI precursor. P = Phosphate (green), I = Inositol (yellow), GN = Glucosamine (orange), M = mannose (blue), EN = ethanolamine (purple).

