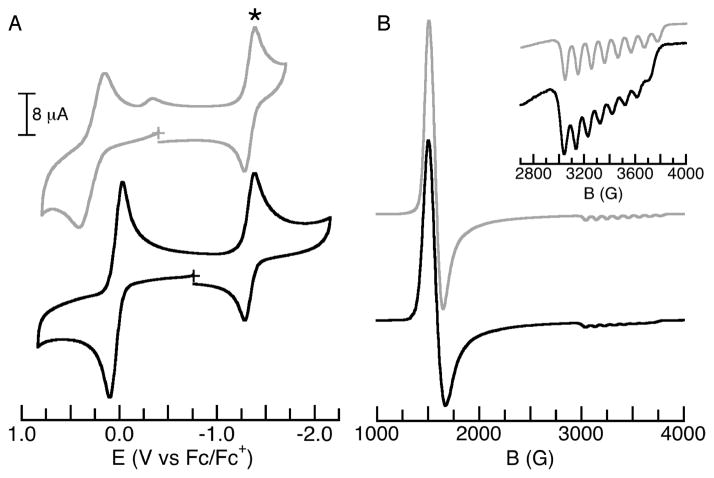
Figure 4.
Cyclic voltammograms (A) and ⊥-mode EPR spectra (B) of [CoIIMST(OH2)]− (black line) and [CoII(μ-OH2)CaIIOH2]+ (gray line). Cobaltocenium (*) was used as an internal standard in the CV experiments. The voltammograms were recorded at room temperature in DCM (with 0.1 M TBAPF6) and the EPR data were collected at 10 K on frozen DCM solution (6 mM). Inset: comparison of the hyperfine interactions for the two CoII–aquo complexes. See Table 2 for E1/2, g- and Az-values.

