
Fig. 2.
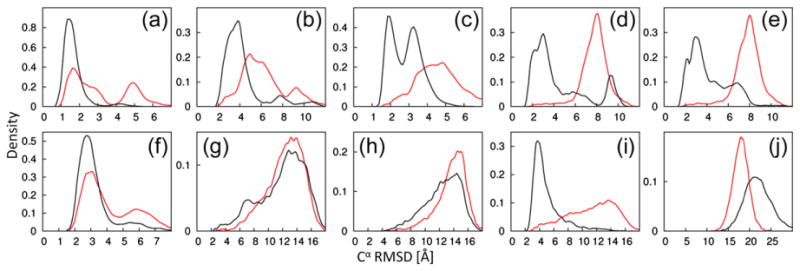
Improved conformational sampling by PCS-ROSETTA. We carried out 10,000 independent low-resolution trajectories with (black) or without (red) PCS information. The plots show the density of Cα rmsd values to the target structure after the fragment assembly step. The targets are labeled as in Table 1. Corresponding plots of structures calculated with full-atom relaxation for positioning the amino acid side chains are shown in Supporting Information Fig. 2. The library used for fragment selection explicitly excluded any protein with sequence similarity to the target protein. The figure shows that PCS scores efficiently guide fragment assembly toward the correct target structure.