
Fig. 3.
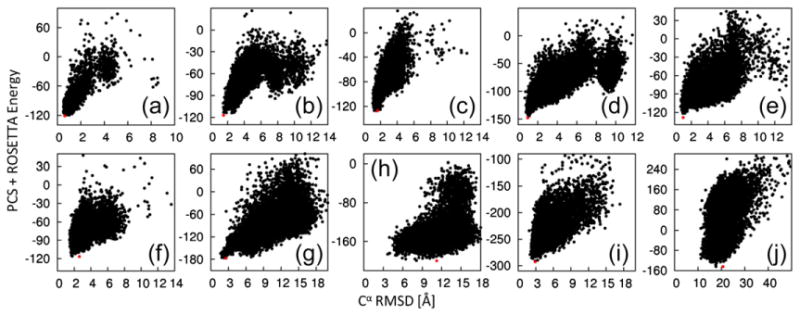
Energy landscapes generated by PCS-ROSETTA. Combined ROSETTA energy and PCS score [using the weighting factor w(c)] are plotted versus the Cα rmsd to the target structure for structures calculated using PCS-ROSETTA. The lowest-energy structures are indicated in red. The targets are labeled as in Table 1. The results show that PCS-ROSETTA is likely to generate and identify the correct fold.