
Figure 8.
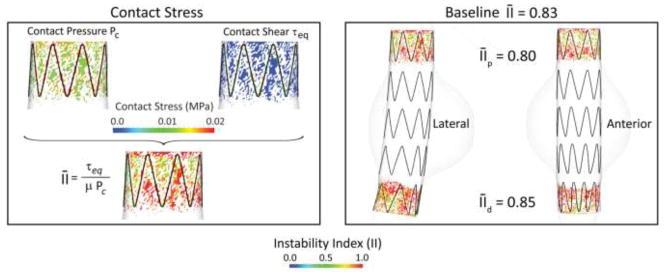
Left: Plot of contact pressure Pc, contact shear: τeq, and instability index II at proximal the proximal fixation zone for the baseline endograft. Left: Plot of instability index for the Baseline model in lateral and anterior views.
Official websites use .gov
A
.gov website belongs to an official
government organization in the United States.
Secure .gov websites use HTTPS
A lock (
) or https:// means you've safely
connected to the .gov website. Share sensitive
information only on official, secure websites.
Left: Plot of contact pressure Pc, contact shear: τeq, and instability index II at proximal the proximal fixation zone for the baseline endograft. Left: Plot of instability index for the Baseline model in lateral and anterior views.