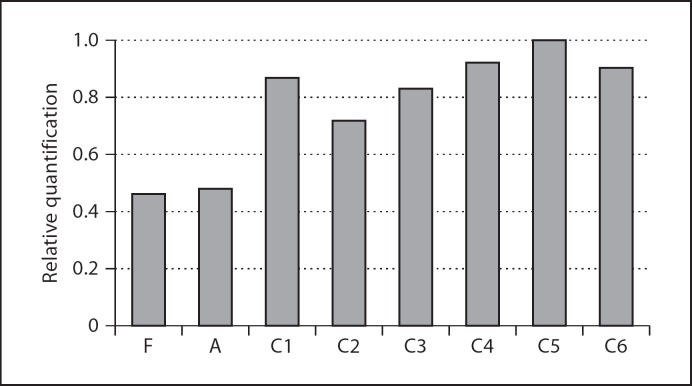
Fig. 3.
Confirmation test results for HNF1A gene by RQ-PCR. The bars represent the relative quantification of each sample. F (father) and A (affected) are patients with HNF1A gene deletion, C1-6 are normal controls. There is a significant reduction in relative quantification by the patients in comparison with the normal controls (p < 0.05, by t test).

