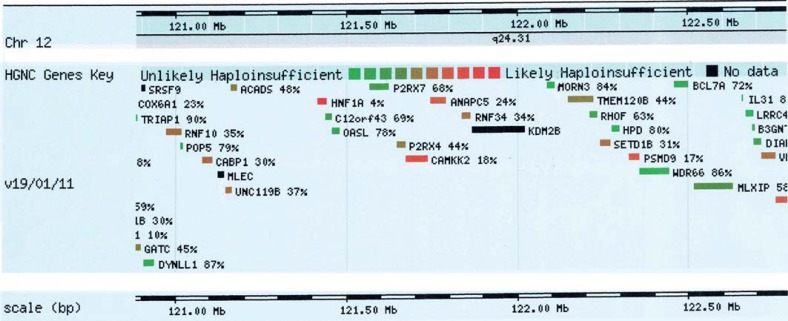
Fig. 5.
Classification of the genes deleted in the region according to their haploinsufficiency, from unlikely haploinsufficient to likely haploinsufficient, according to DECIPHER (http://decipher.sanger.ac.uk/). High ranks (e.g. 0-10%) indicate that a gene is more likely to exhibit haploinsufficiency, low ranks (e.g. 90-100%) indicate a gene is more likely to not exhibit haploinsufficiency.

