
FIGURE 2.
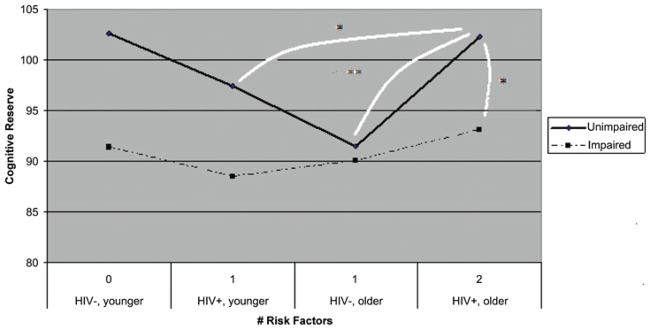
Cognitive reserve by risk level. Subjects with the greatest number of risk factors for cognitive decline but who do not demonstrate notable NP impairment also show the highest level of cognitive reserve. Connective lines indicate the presence of significant group differences. *p <.05. **p <.01. (Color figure available online.)