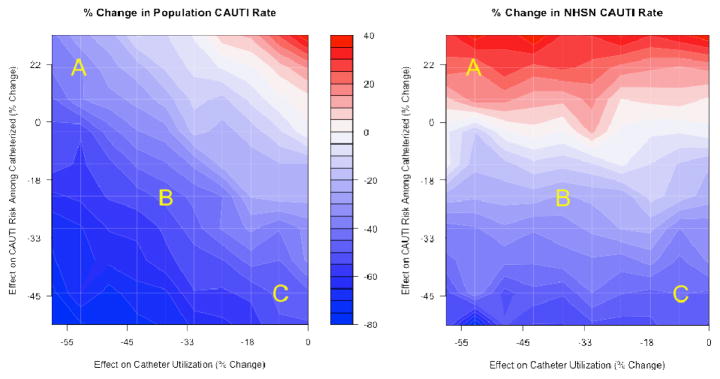
Figure 2.

Percent change in population CAUTI Rate and NHSN CAUTI rate across a wide range of interventions
Notes: (i) CAUTI: catheter-associated urinary tract infection; NHSN: National Healthcare Safety Network. (ii) Points A, B, and C each reflect different simulated interventions. (iii) Red areas indicate that, for interventions represented by these areas, the measure increased from pre- to post-intervention, and similarly blue areas indicate that the measure decreased (the magnitude of the increase or decrease is given by the bar in the center in terms of percent change).
