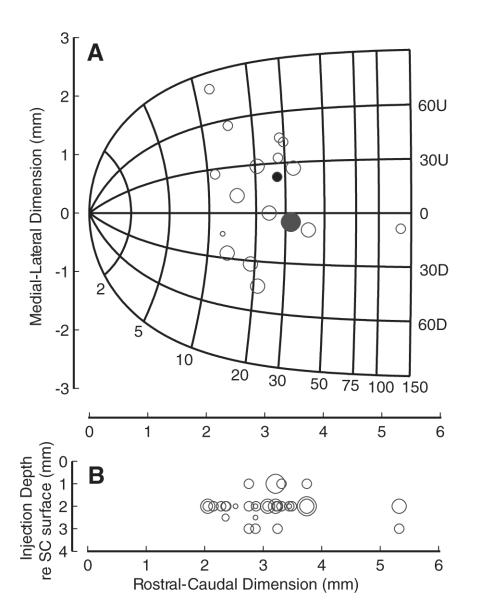
FIG. 2.
Distribution of lidocaine injections within the superior colliculus (SC). A) The location of each each electrode penetration (n = 18) on the collicular map is shown as a circle, and its diameter indicates the number of lidocaine injections (1–4) made on each track. The map was derived by the formula provided by Ottes et al. (1986). The gaze shift amplitude increases logarithmically along the rostral-caudal extent, and the movement direction changes linearly along the medial (upward) to lateral (downward) dimension. The large, filled, gray circle shows the location of the injections for the example data shown in Figs. 3–6. The smaller, filled, black circle shows the location of the injections for the example data shown in Figs. 7–8. B: the depth of each lidocaine injection (n = 45) relative to the SC surface is plotted as a function of its rostral-caudal location. The diameter of the circle indicates the volume of injection (1–4 μl).

