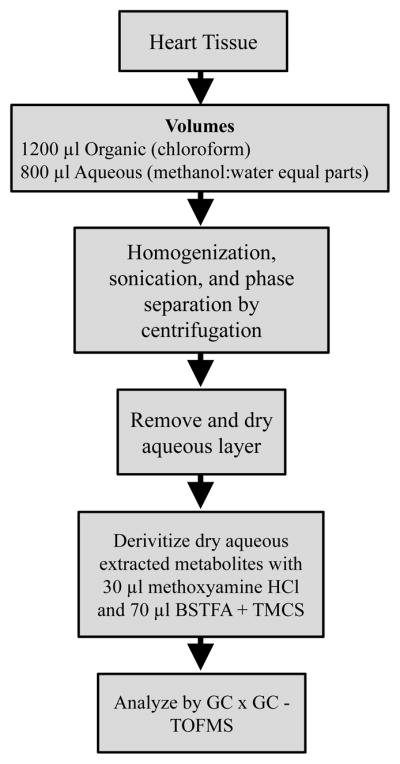
Figure 2.

The tissue mass calibration experiment schematic is shown detailing the procedure used to evaluate the linearity of response of the metabolite signal relative to mass of heart extracted for targeted metabolites. Four nominal masses of heart tissue were taken from three different mice: ~ 40 mg, ~ 20 mg, ~ 10 mg, and ~ 5 mg.
