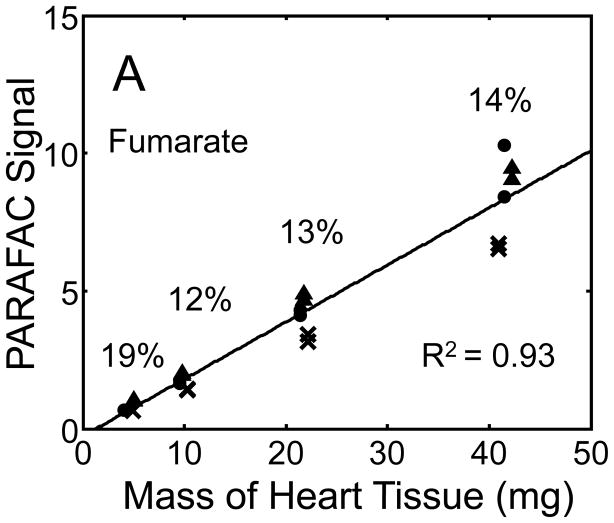
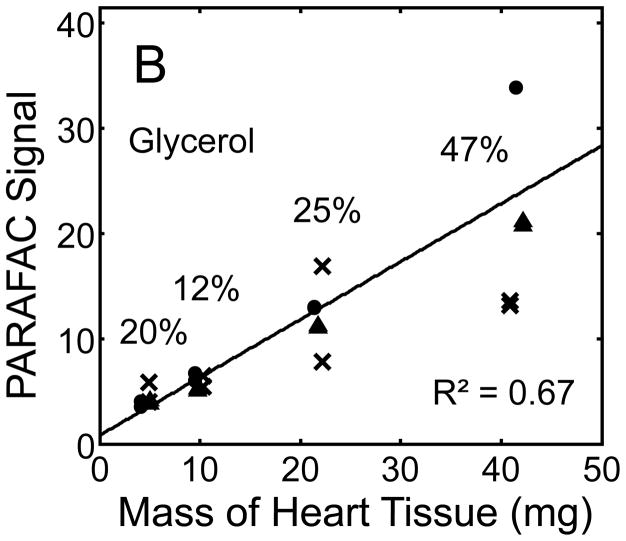
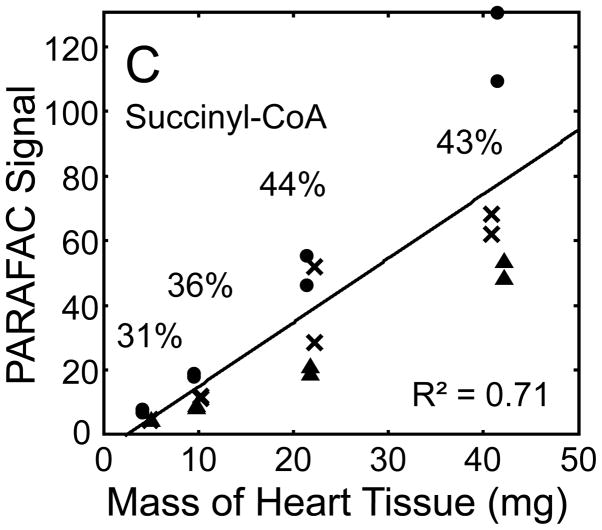
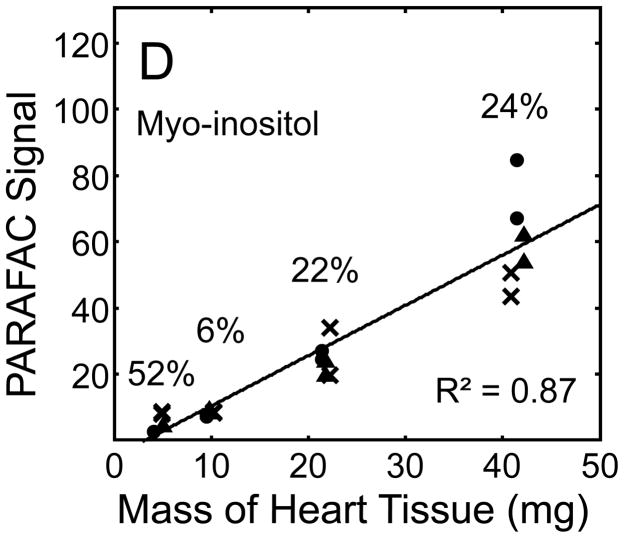
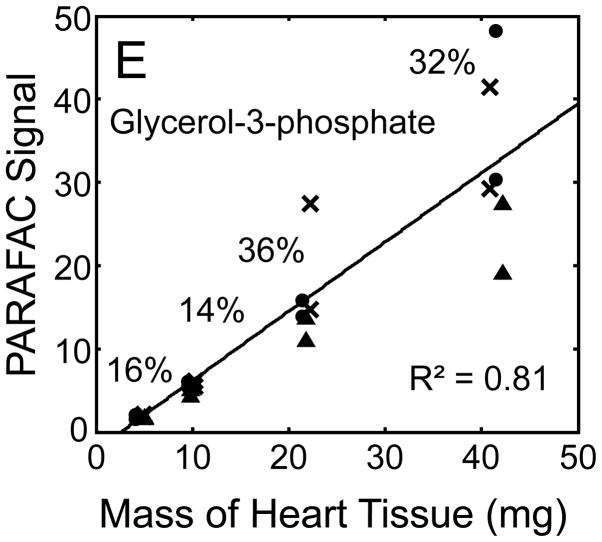
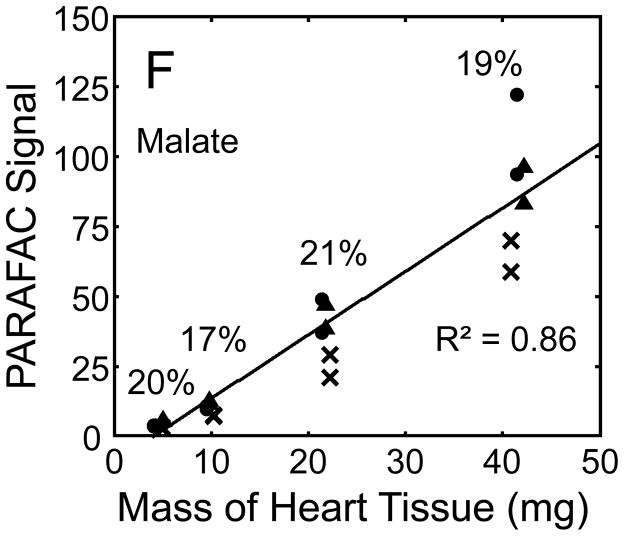
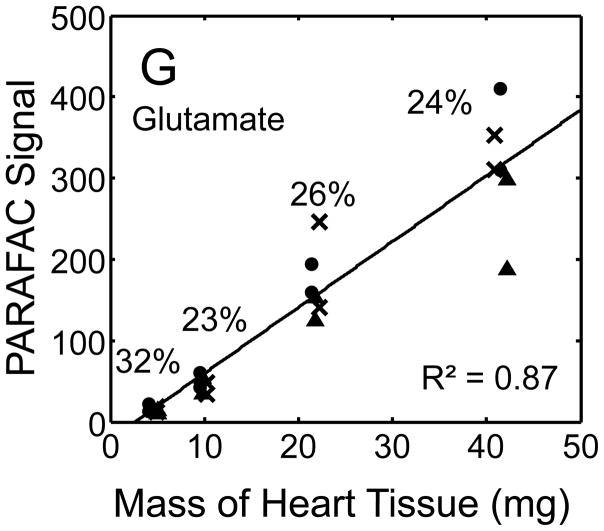
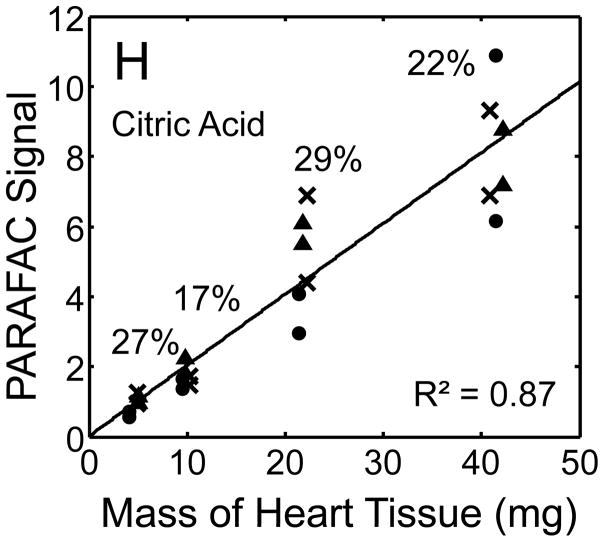
Figure 5.
Quantitative results for the eight representative metabolites following the tissue mass calibration experiment (using procedure outlined in Fig. 2) based upon extracting four different masses of heart tissue from three different hearts is shown. Different hearts are shown as different symbols. Duplicate injections of each piece of heart were analyzed. Signal for each metabolite was determined using PARAFAC software [20, 21]. The linear relationship between the mass of heart extracted and the signal detected for each metabolite is provided. The PARAFAC signals have been scaled down by 100,000 for clarity. The biological variation across six injections (three mice) is indicated as the RSD for each grouping of heart tissue masses (masses varied less than 4% RSD for each group). Linear regression is shown with Pearson’s correlation coefficient, with results indicating good linearity. The high residuals and low correlation coefficient observed is dominated by the biological variation. Linearity was also observed for many other metabolites (not shown for brevity).

