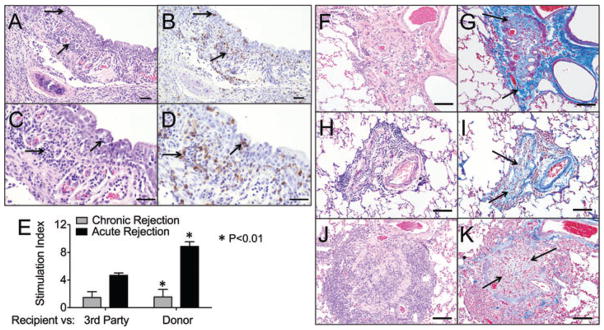
Figure 3. Lymphocytic bronchiolitis and obliterative bronchiolitis in allografts.

(A) An airway with extensive infiltrates of lymphocytes (arrows) in the epithelium and submucosa, (B) Serial section stained with anti-CD3 showing the lymphocytic infiltrate is predominantly T lymphocytes. (C and D) Higher magnification of panels A and B, respectively (bar = 50 μm). (E) Mixed lymphocyte reaction (72 h) were performed using recipient splenocytes as effector cells against Concanavalin A (Con A), irradiated donor splenocytes, and third party irradiated splenocytes from another ferret. The stimulation index was calculated by dividing the T cell responses to the stimulator cells with the CPMs of the responder cells alone. Animals with severe acute rejection had a significantly higher stimulation index (p < 0.01) than animals that developed chronic rejection. Statistics were performed using the one-way ANOVA and Bonferroni’s posttest (acute rejection n = 3 animals, chronic rejection n = 4 animals, animals are marked in Table 1). Those animals labeled acute rejection had early nonresponsive diffuse acute rejection by CT and histologically. Those animals labeled chronic rejection had late localized acute rejection and predominantly CR2 chronic rejection on histology. (F–K) Representative images from three independent ferret lungs with obliterative bronchiolitis. (F, H, J) OB lesions in all animals were characterized by complete airway occlusion and lymphocytic infiltrates (H&E staining). (G, I and K) Masson’s trichrome stain demonstrating collagen deposition in and surrounding the airways (light blue staining, arrows) (bars = 50 μm).
