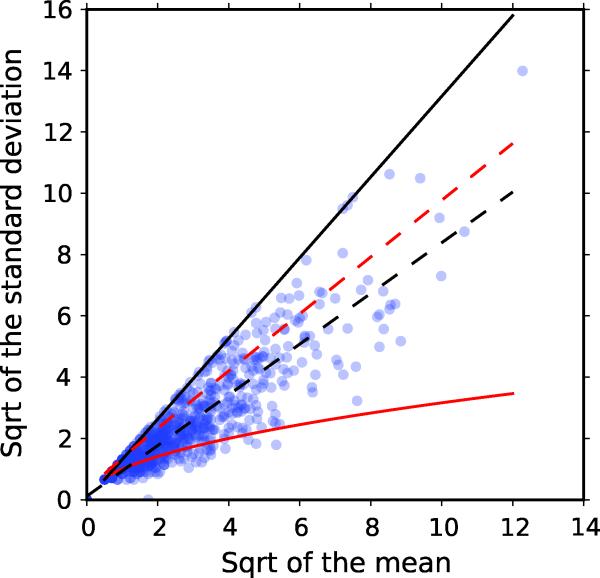
Figure 3. Over-dispersion of the individual-level data.
This figure shows the mean and standard deviation of the total number of contacts for each of the 882 individuals in the study. The square roots of the mean and standard deviation were calculated for contacts of any type over four equally spaced observational periods comprising two years of total observation. The square root transformation was used to reduce the spread of the data and make the figure more readable. The solid red line indicates the expected variance for a Poisson process with a given mean, the solid black line is the maximum variance for a sequence of four observations at a given mean, the dashed black line is a linear model of the transformed data, and the red dashed line is the Negative Binomial model of the data.

