
Figure 8:
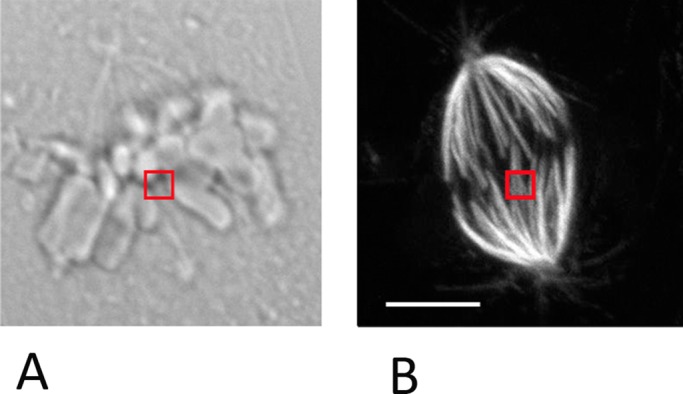
(A) Differential interference contrast image of a PtK cell, illustrating the position of the trap at the interface between the kinetochore and the kinetochore microtubules. The trap is represented by the red square. The trap was applied for 4 min with a power of 44.5 mW. (B) The PtK cell from Figure 4E stained with tubulin antibody. No damage to the microtubules is visible in the region in which the trap was applied (red square). Bar, 10 μm.