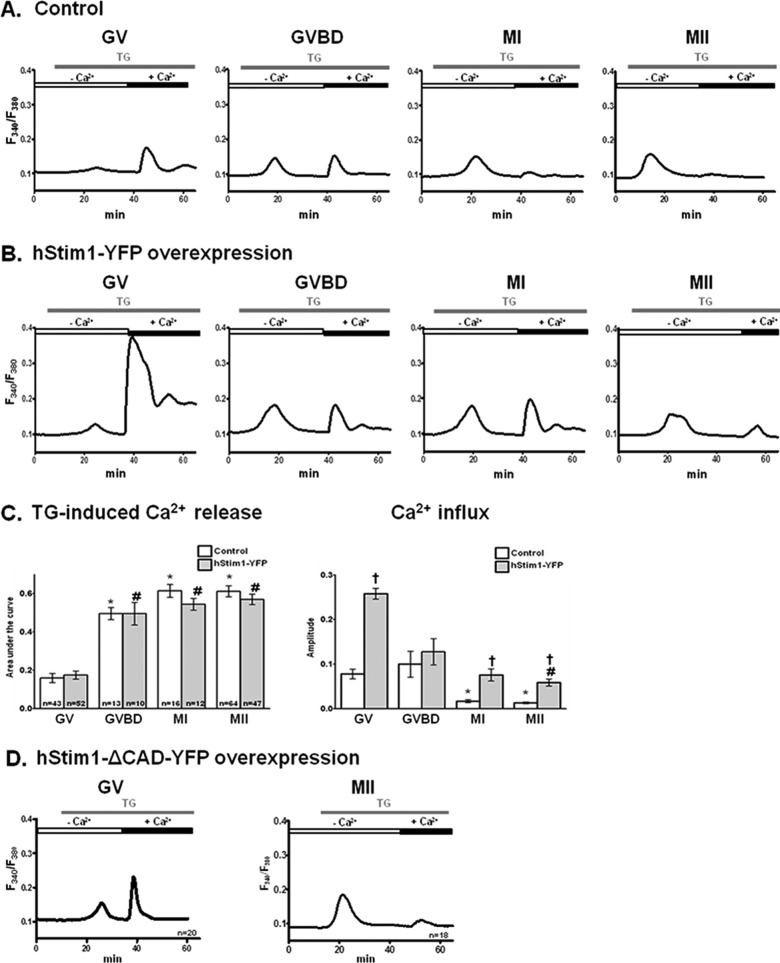
FIGURE 2:
[Ca2+]ER content increases, whereas Ca2+ influx induced by TG, SOCE, decreases during oocyte maturation. [Ca2+]ER content was estimated from the [Ca2+]i responses caused by addition of 10 μM TG in oocytes incubated in Ca2+-free medium, and Ca2+ influx was estimated by the [Ca2+]i rise generated by the addition of 5 mM CaCl2 soon after the TG-induced [Ca2+]i rise had subsided. Representative [Ca2+]i traces are shown for control oocytes (A) or for oocytes expressing hStim1-YFP (B). (C) TG- and CaCl2-induced [Ca2+]i changes were quantified, and data are presented in bar graphs as mean ± SEM. Control and hStim1-YFP–expressing oocytes are displayed in open and gray columns, respectively, and the number of oocytes evaluated is shown within each bar. *,#Stages significantly different from the GV-stage values within treatment group. †Significant differences within the same meiotic stage but between treatments (p < 0.05). (D) TG-induced [Ca2+]i responses and subsequent Ca2+ influx in oocytes and eggs expressing hStim1-ΔCAD-YFP, an Stim1 variant incapable of interacting with Orai1.

