FIGURE 4:
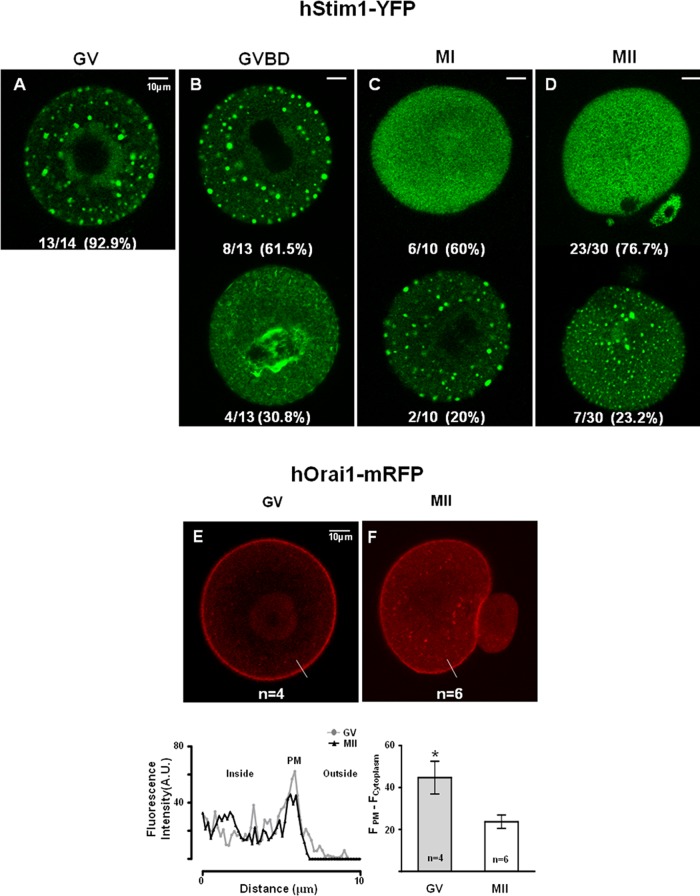
The distribution and organization of hStim1-YFP and hOrai1-mRFP change during oocyte maturation. (A–D) The distribution of hStim1-YFP was examined using confocal microscopy from images taken at the equatorial plane of live hStim1-YFP–expressing oocytes. The number of oocytes examined at each stage is shown at the bottom of each representative image. hStim1-YFP displayed two distinct patterns of organization in all stages of maturation except the GV stage; the most representative configurations are shown, along with the proportion of oocytes/eggs exhibiting the particular pattern. (E, F) The distribution of hOrai1 was examined as in the foregoing in GV and MII oocytes expressing hOrai1-mRFP. Intensity profiles of the line scans drawn in oocytes and eggs are shown below E, and a bar graph displaying the relative intensity of Orai1 signal between PM and cytoplasm is shown below F. Scale bar, 10 μm.

