FIGURE 5:
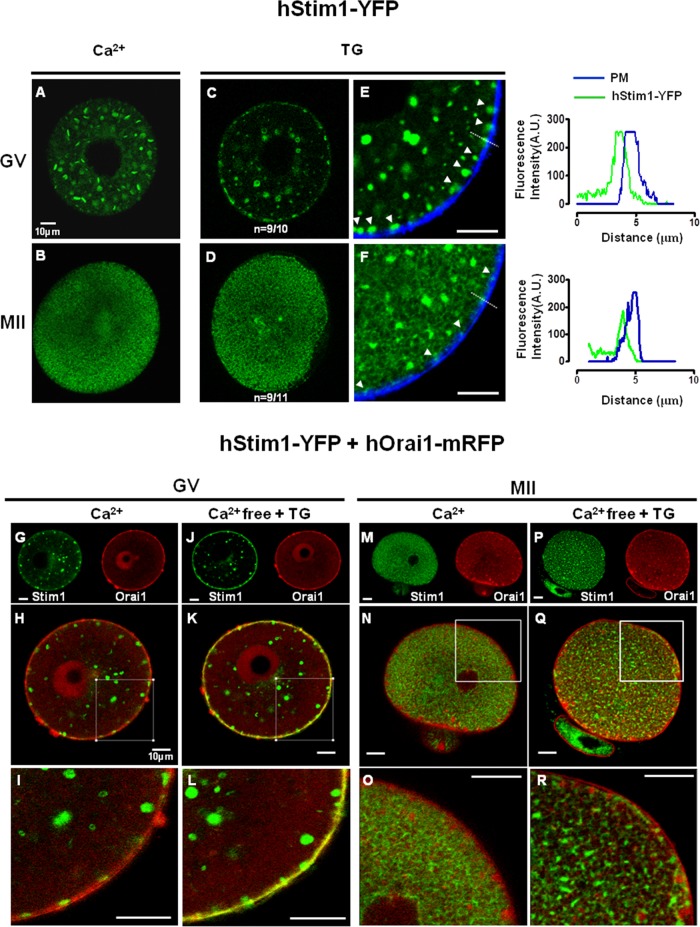
hStim1 puncta formation and colocalization with hOrai1 decreases during oocyte maturation. (A, B) Under control conditions, hStim1-YFP forms internal aggregates in GV oocytes, whereas in MII eggs it acquires a more homogenous, ER-like organization. After depletion of [Ca2+]ER, hStim1-YFP undergoes “puncta” formation in GV oocytes (C), whereas hStim1-YFP distribution is hardly changed in MII oocytes (D). Arrowheads point to hStim1-YPF puncta (E, F), and line graphs depicting the fluorescence intensity of these puncta, marked with a broken line, are shown to the right of E and F. (E, F) The proximity of the hStim1-YFP puncta/aggregates to the PM was estimated by staining the PM with wheat germ agglutinin–Alexa 664. hStim1-YPF puncta are bigger and more numerous in GV oocytes than in MII eggs. (G–R) Confocal images before and after TG treatment of GV oocytes (G–L) and MII eggs (M–R) expressing hStim1-YFP+hOrai1-mRFP. The same oocytes/eggs were imaged before and after TG. Top, separate fluorescent channels; middle, merged images; bottom, amplified regions of these are. hStim1 and hOrai1 display extensive overlap after the addition of TG in GV oocytes (K, L), but the overlap is negligible at the MII stage (Q, R). Scale bar, 10 μm.

