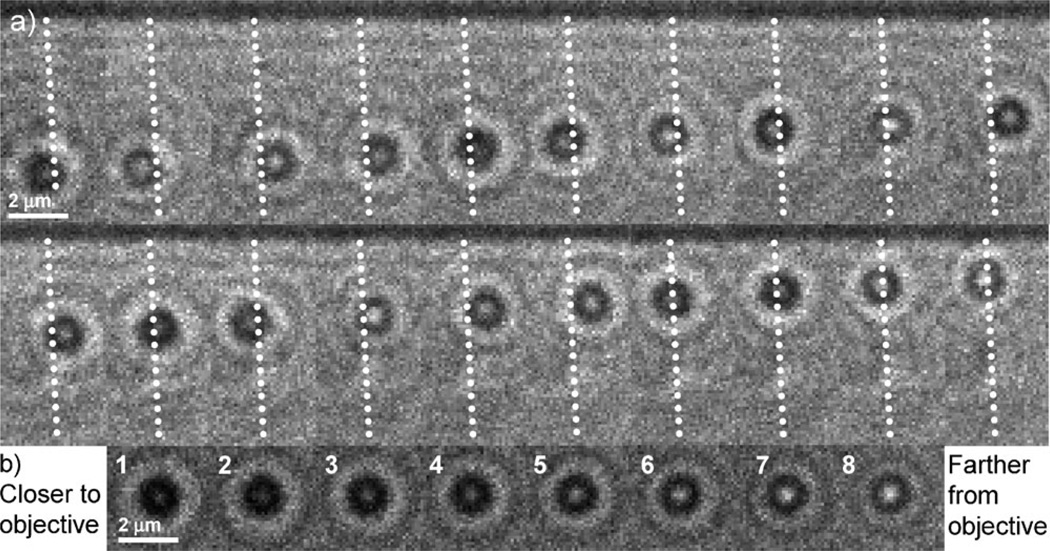
Fig. 2.
(a) A series of bright-field optical micrographs of a myosin V-coated bead traveling along a tightly suspended actin filament. The illuminating condenser is stopped down from its maximum to increase contrast. The viewing objective is located below the sample. The time interval between frames is 850 ms and the exposure time is 80 ms. For clarity, dotted lines are overlaid on the actin filament. (b) Images of a stationary bead on the microscope slide surface moved in 150 nm increments along the optical axis, z. Images 1 and 8 are, respectively, closer to and farther from the imaging objective.

