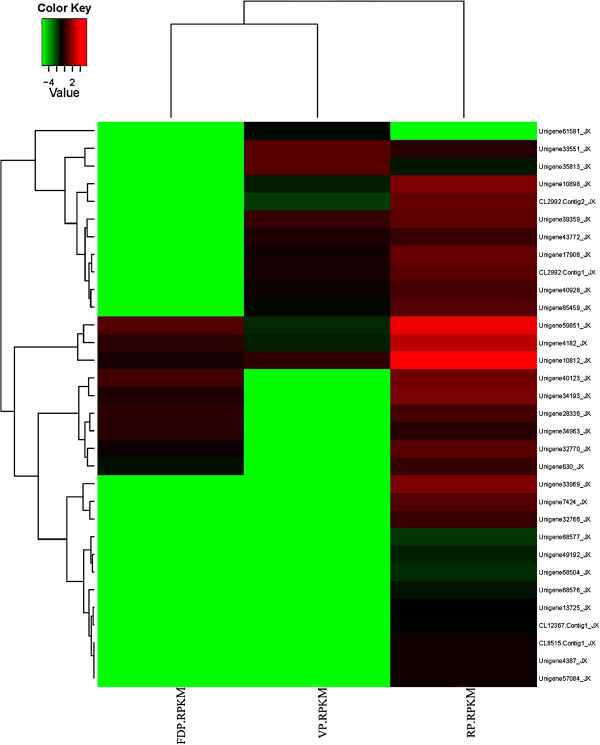
Figure 8.
Differential expression genes related with flower development in C. sinense DGE. Each column represents an experimental sample (e.g. VP, FDP and RP) and each row represents a gene. Expression differences are shown in different colors. Red means high expression and green means low expression.

