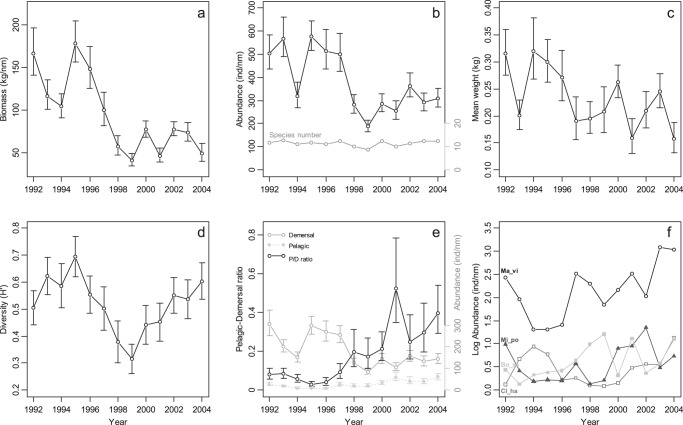
Figure 2. Fish community parameters for each year 1992−2004.
The mean biomass (a), mean abundance and (with scale on right) species number (b), mean weight of individual fish (c), Shannon–Weaver diversity (H’) (d), the mean P/D ratio and (with scale in the right) pelagic and demersal fish abundances (e), and mean log-transformed abundance of four pelagic species (f) Mallotus villosus (circles), Boreogadus saida (solid gray squares), Micromesistius poutassou (triangles) and Clupea harengus (open squares). The 95% confidence intervals for the means are shown in most cases based on the log-transformed data after reweighting to be representative of the sampling regions.

